Fitting a line to Gaussian data with known covariance matrix
In [1]:
%matplotlib inline
import numpy as np
import matplotlib.pyplot as pl
import oktopus
from oktopus import MultivariateGaussianLikelihood
from oktopus.models import ExpSquaredKernel, WhiteNoiseKernel
from matplotlib import rc
rc('text', usetex=True)
font = {'family' : 'serif',
        'size'   : 18,
        'serif'  : 'New Century Schoolbook'}
rc('font', **font)
In [2]:
x = np.linspace(0, 10, 100)
def mean(m, b):
    return m * x + b
def cov(k, l, s):
    return ExpSquaredKernel(x).evaluate(k, l) + WhiteNoiseKernel(len(x)).evaluate(s)
np.random.seed(2)
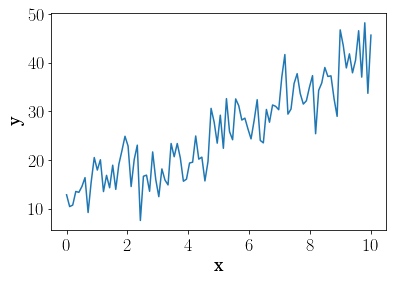
fake_data = np.random.multivariate_normal(mean(3, 10), cov(1, 1, 4))
pl.plot(x, fake_data)
pl.ylabel("y")
pl.xlabel("x")
Out[2]:
<matplotlib.text.Text at 0x110ed9320>

In [3]:
logL = MultivariateGaussianLikelihood(fake_data, mean, cov(1, 1, 4), 2)
In [4]:
MLE = logL.fit(x0=[-2, 5], method='powell')
MLE
Out[4]:
direc: array([[ 0.        ,  1.        ],
       [-0.64464562,  3.22322808]])
     fun: 339.00598722690825
 message: 'Optimization terminated successfully.'
    nfev: 136
     nit: 3
  status: 0
 success: True
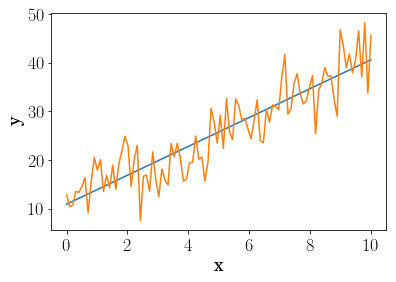
       x: array([  2.96196725,  10.96020354])
In [5]:
pl.plot(x, mean(*MLE.x))
pl.plot(x, fake_data)
pl.ylabel("y")
pl.xlabel("x")
Out[5]:
<matplotlib.text.Text at 0x110f764e0>

In [6]:
logL.uncertainties(MLE.x)
Out[6]:
array([ 0.18975499, 1.10638358])
In [ ]: