This page contains OUT-OF-DATE, archived data release notes for past pipeline processings. Campaigns seen here have been processed with the final version of the K2 pipeline (see news post here) and new, up-to-date release notes corresponding to the newest data are available at the nominal data release note webpage.
The notes below are kept here in case users find a need to use the old, out-of-date processed data, which is still accessible at MAST in these locations for each file type:
- Target Pixel Files: http://archive.stsci.edu/missions/k2/target_pixel_files/old_release_bundles/
- Lightcurves: http://archive.stsci.edu/missions/k2/lightcurves/old_release_tarfiles/
- CBV files: http://archive.stsci.edu/missions/k2/cbv/old_release_files/
- FFIs: http://archive.stsci.edu/missions/k2/ffi/old_release_files/
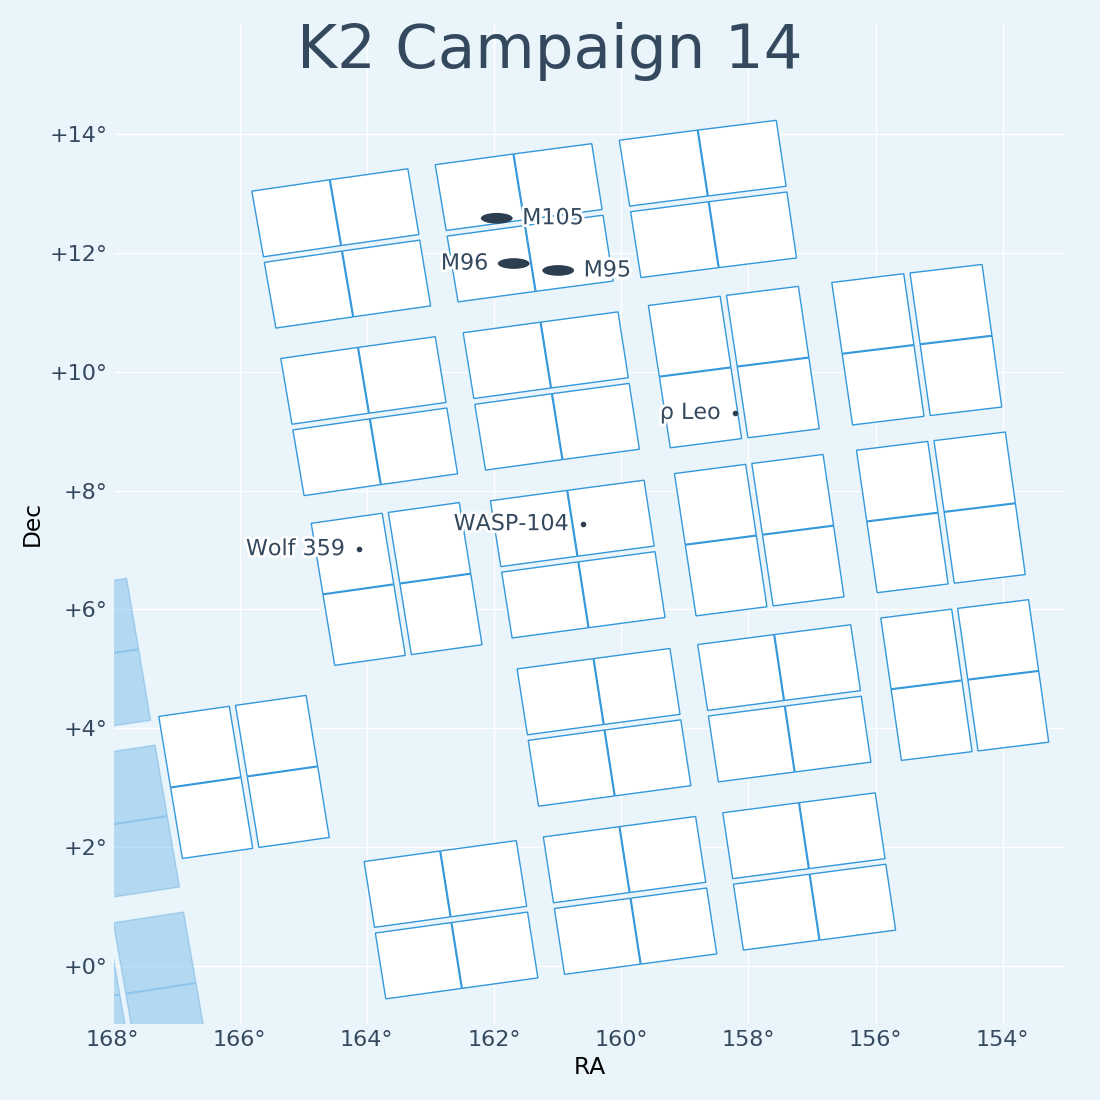
K2 Campaign 14 (Archived)
At a glance
- RA: 160.6824762 degrees
- Dec: 6.8509316 degrees
- Roll: 158.7573464 degrees
- 39,024 EPIC IDs in long cadence (LC).
- 147 EPIC IDs in short cadence (LC).
- 42 moving objects were tiled with LC custom strip apertures. 7 bright stars were assigned 24-pixel diameter LC disk apertures to capture the point spread function wings. See the csv file that maps the custom aperture number to the target name to find the apertures for a specific target.
- Start Time: 2017-06-01 05:06:29 UTC
- Long Cadence Number: 145045
- Short Cadence Number: 4339810
- End Time: 2017-08-19 22:11:02 UTC
- Long Cadence Number: 148945
- Short Cadence Number: 4456839
Features and Events
Galaxies
The C14 field of view sits at 53º N Galactic latitude in the North Galactic cap. There are 14,691 galaxies targeted in the C14 field of view. 47 of the Galaxies with radii > 40 arcseconds were covered with large circular masks. Twelve galaxies were covered with 15x15 pixel square masks. Six galaxies (M95, M96, M105, NGC3384, NGC3423, NGC3412) were covered by 40x40 pixel square masks consisting of 16 tiles of 10x10 pixel sub-masks. The custom aperture file gives the custom EPIC ID for each of these masks. This mapping file has changed format with this release and now includes more information. The six columns, which are populated according to target type are:
- custom KepId
- target type: 1 = star, or quasi-stellar object with an EPIC ID, 2 = engineering data (not used here), 3 = open cluster or other large patch of the sky with no individual object, 4 = a central object, but with no EPIC ID, 5 = Solar System object
- the EPIC number, if it exists
- RA of the center of the sky patch (type 3), or center of the extended object (type 4)
- Declination of the center of the sky patch (type 3), or center of the extended object (type 4)
- Object name
In addition to the many galaxies, a number of notable targets were observed during C14, including Wolf 359, a nearby late M-dwarf.
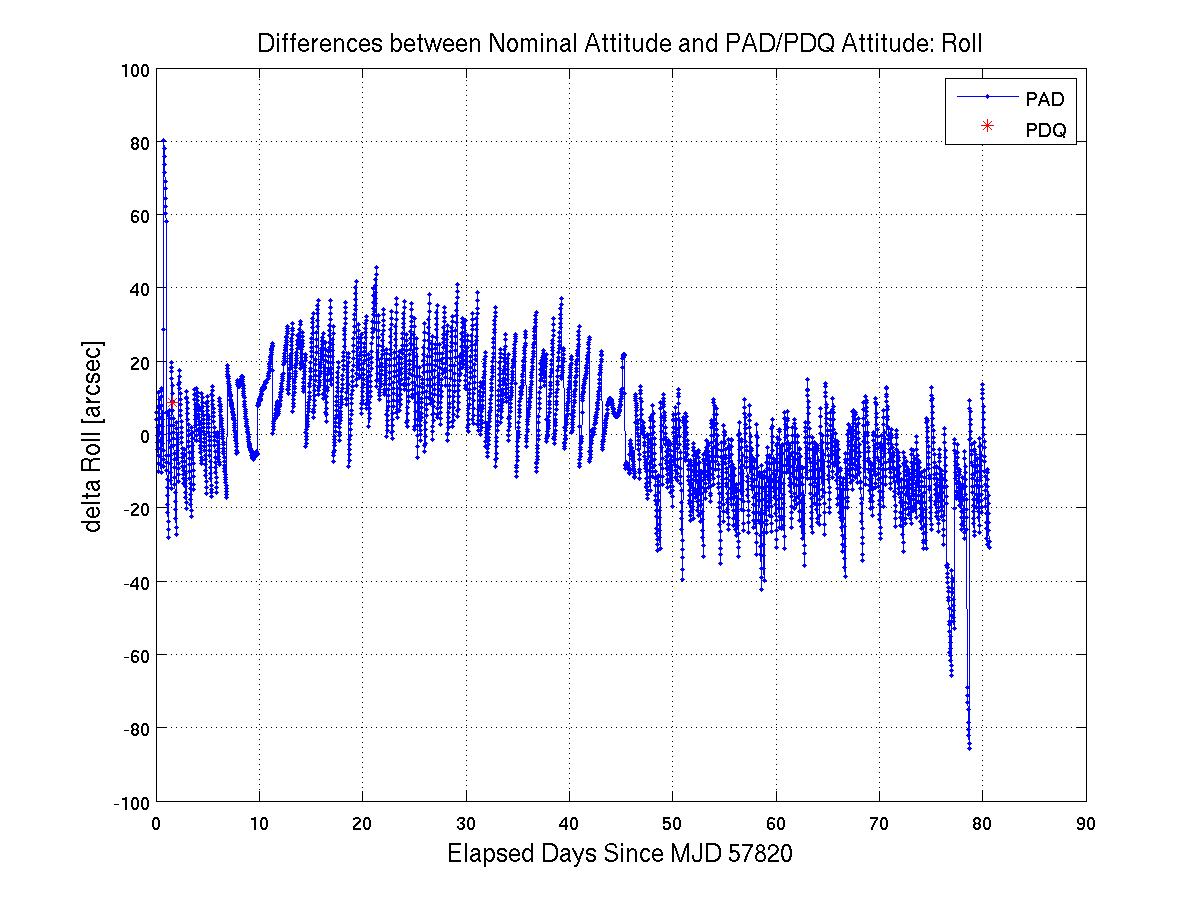
Pointing and Roll Performance
The C14 pointing and roll behavior are well within the limits of that seen in other K2 campaigns for the majority of the campaign. The pipeline calculated maximum distance between the derived and nominal positions for any target (the "maximum attitude residual", or MAR) for C14 is less than 2 pixels, well under the 3-pixel limit accommodated by the aperture halos. There were far fewer anomalous thruster firing events in C14 than were seen in recent campaigns.
In order to give the flight system engineers an advanced warning of degradation in the pointing as fuel runs low, the on-board fine point fault logging threshold was lowered from ~103 arcseconds (0.0005 radians) to ~62 arcseconds (0.0003 radians) on 2017-07-14, mid-way through C14. While this change does not affect pointing performance, it did have the unintended effect of flagging more cadences as "Spacecraft is not in fine point" (QUALITY flag bit #16, decimal=32768), which the pipeline then gaps. The result of this threshold change is that there are 129 long cadences gapped as not-in-fine-point in C14 versus 48 in C13, with the majority of these falling in the second half of C14, after the threshold change. The not-in-fine-point cadences have calibrated pixels in the archive TPFs, but no flux values in the light curve files.
The project has identified a workaround for the flagging resulting from this changed threshold and has implemented it for future processing starting with C15.


Data Quality and Processing Notes
Light Curve Quality
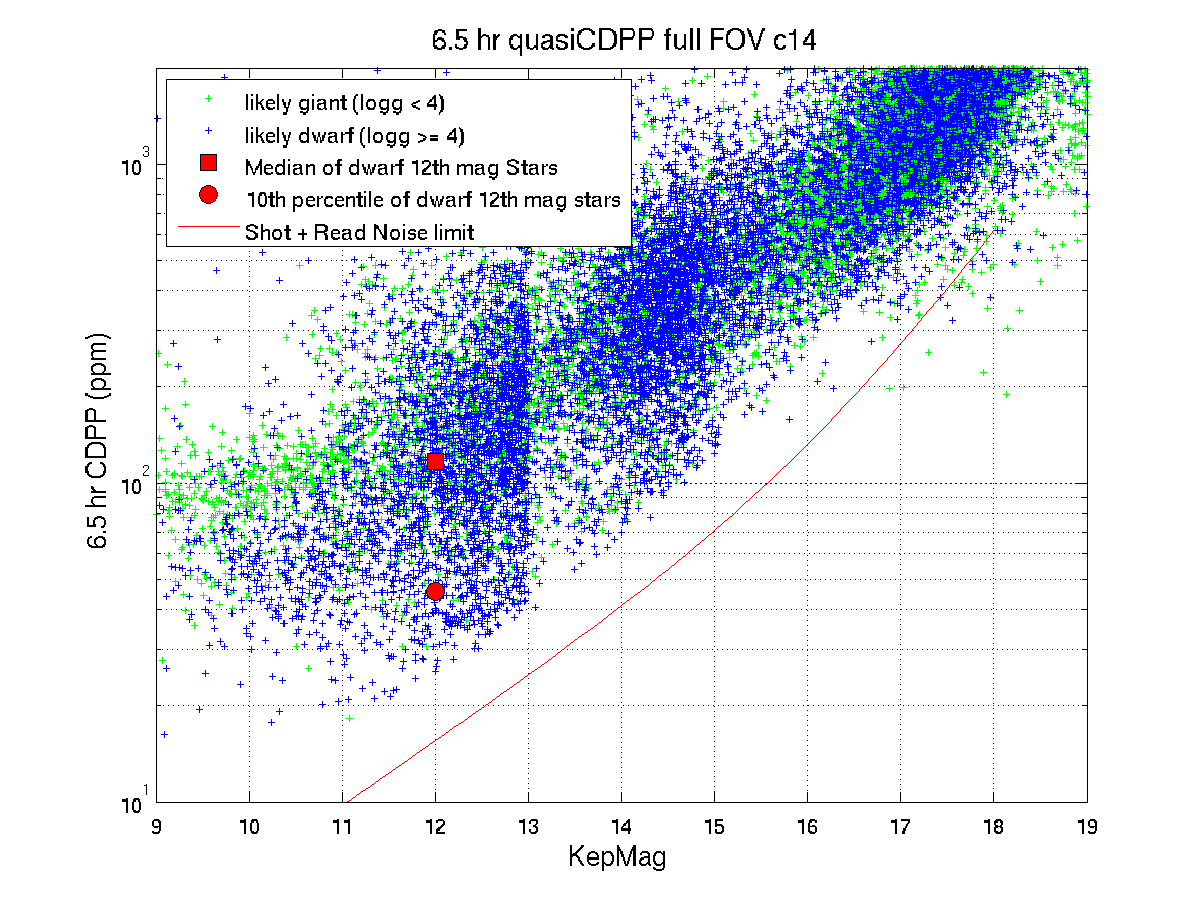
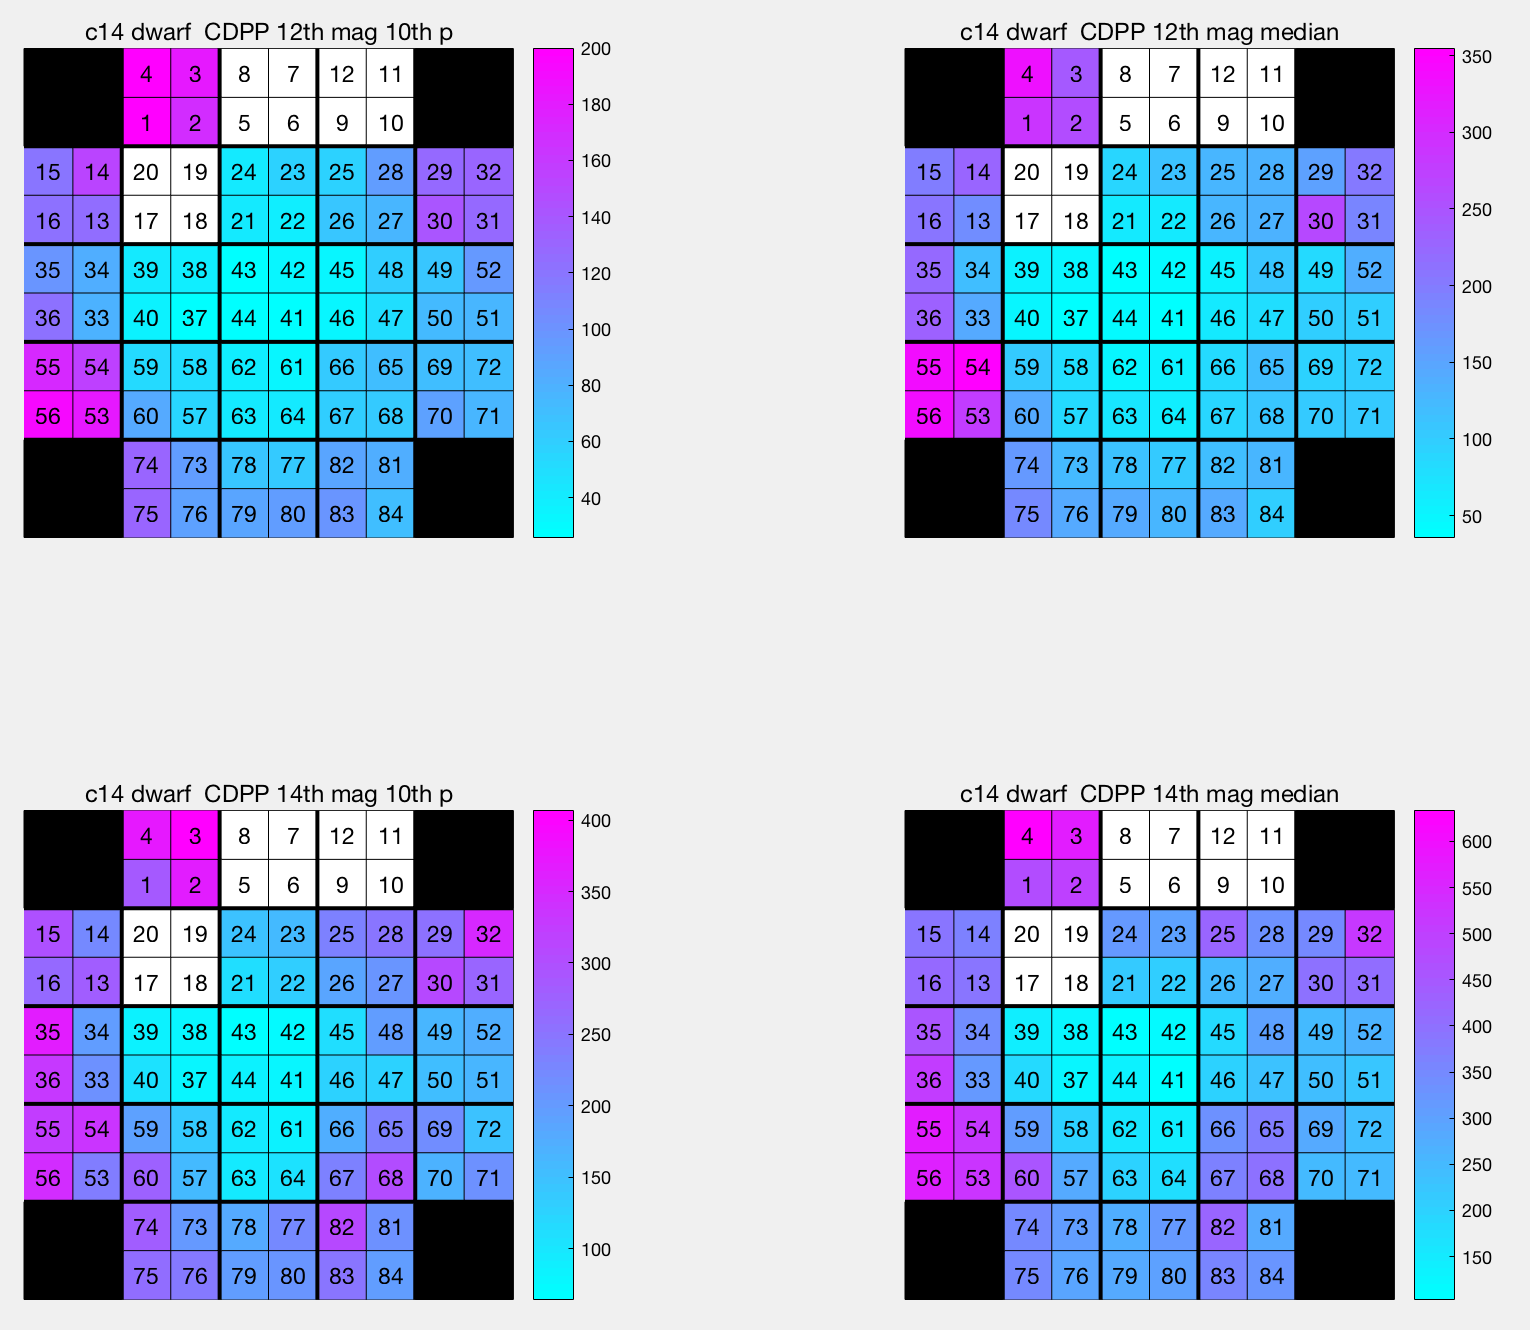
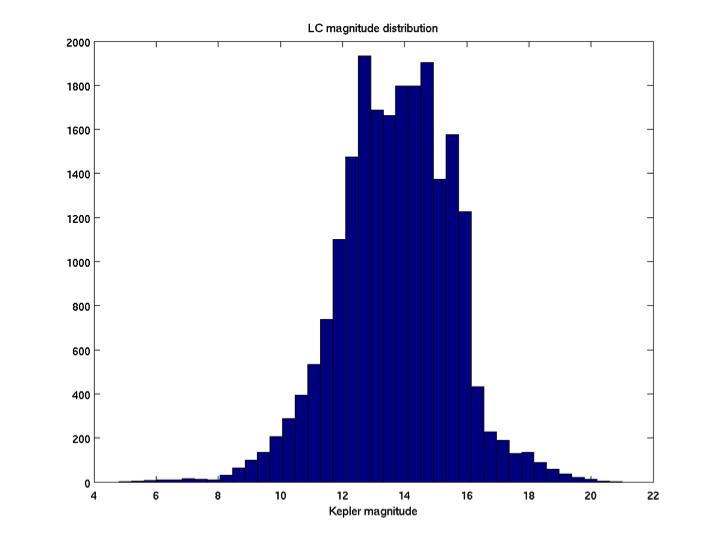
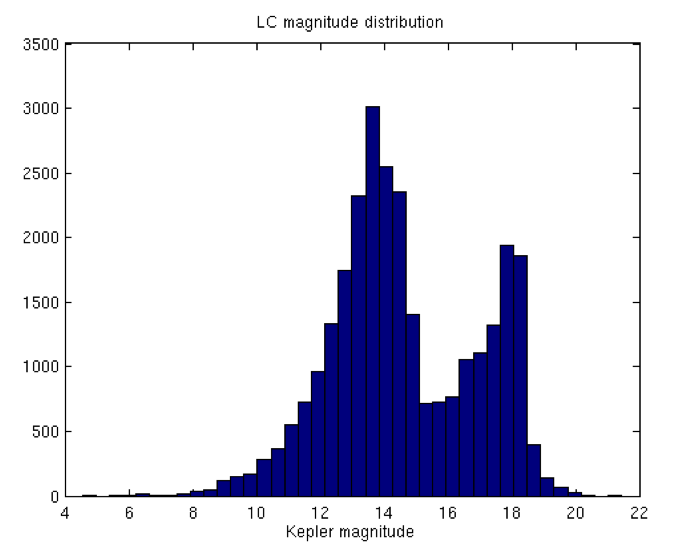
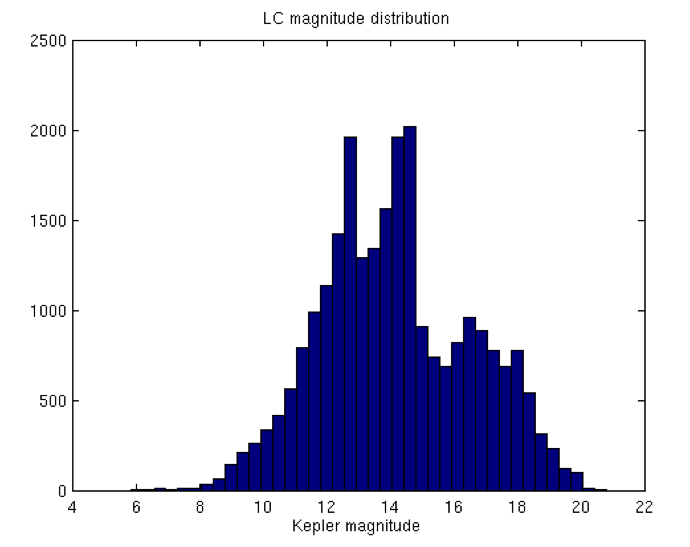
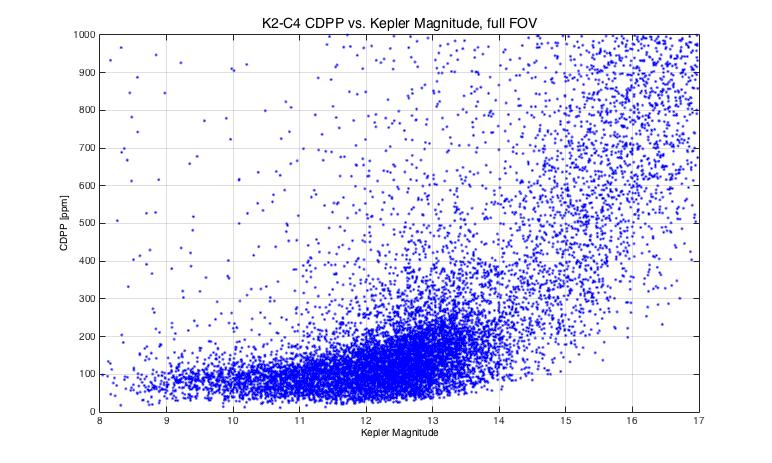
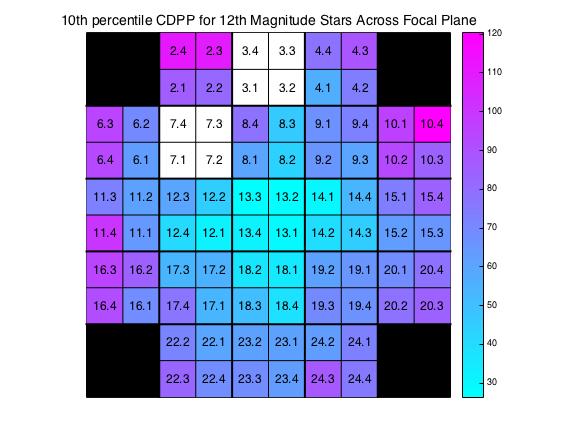
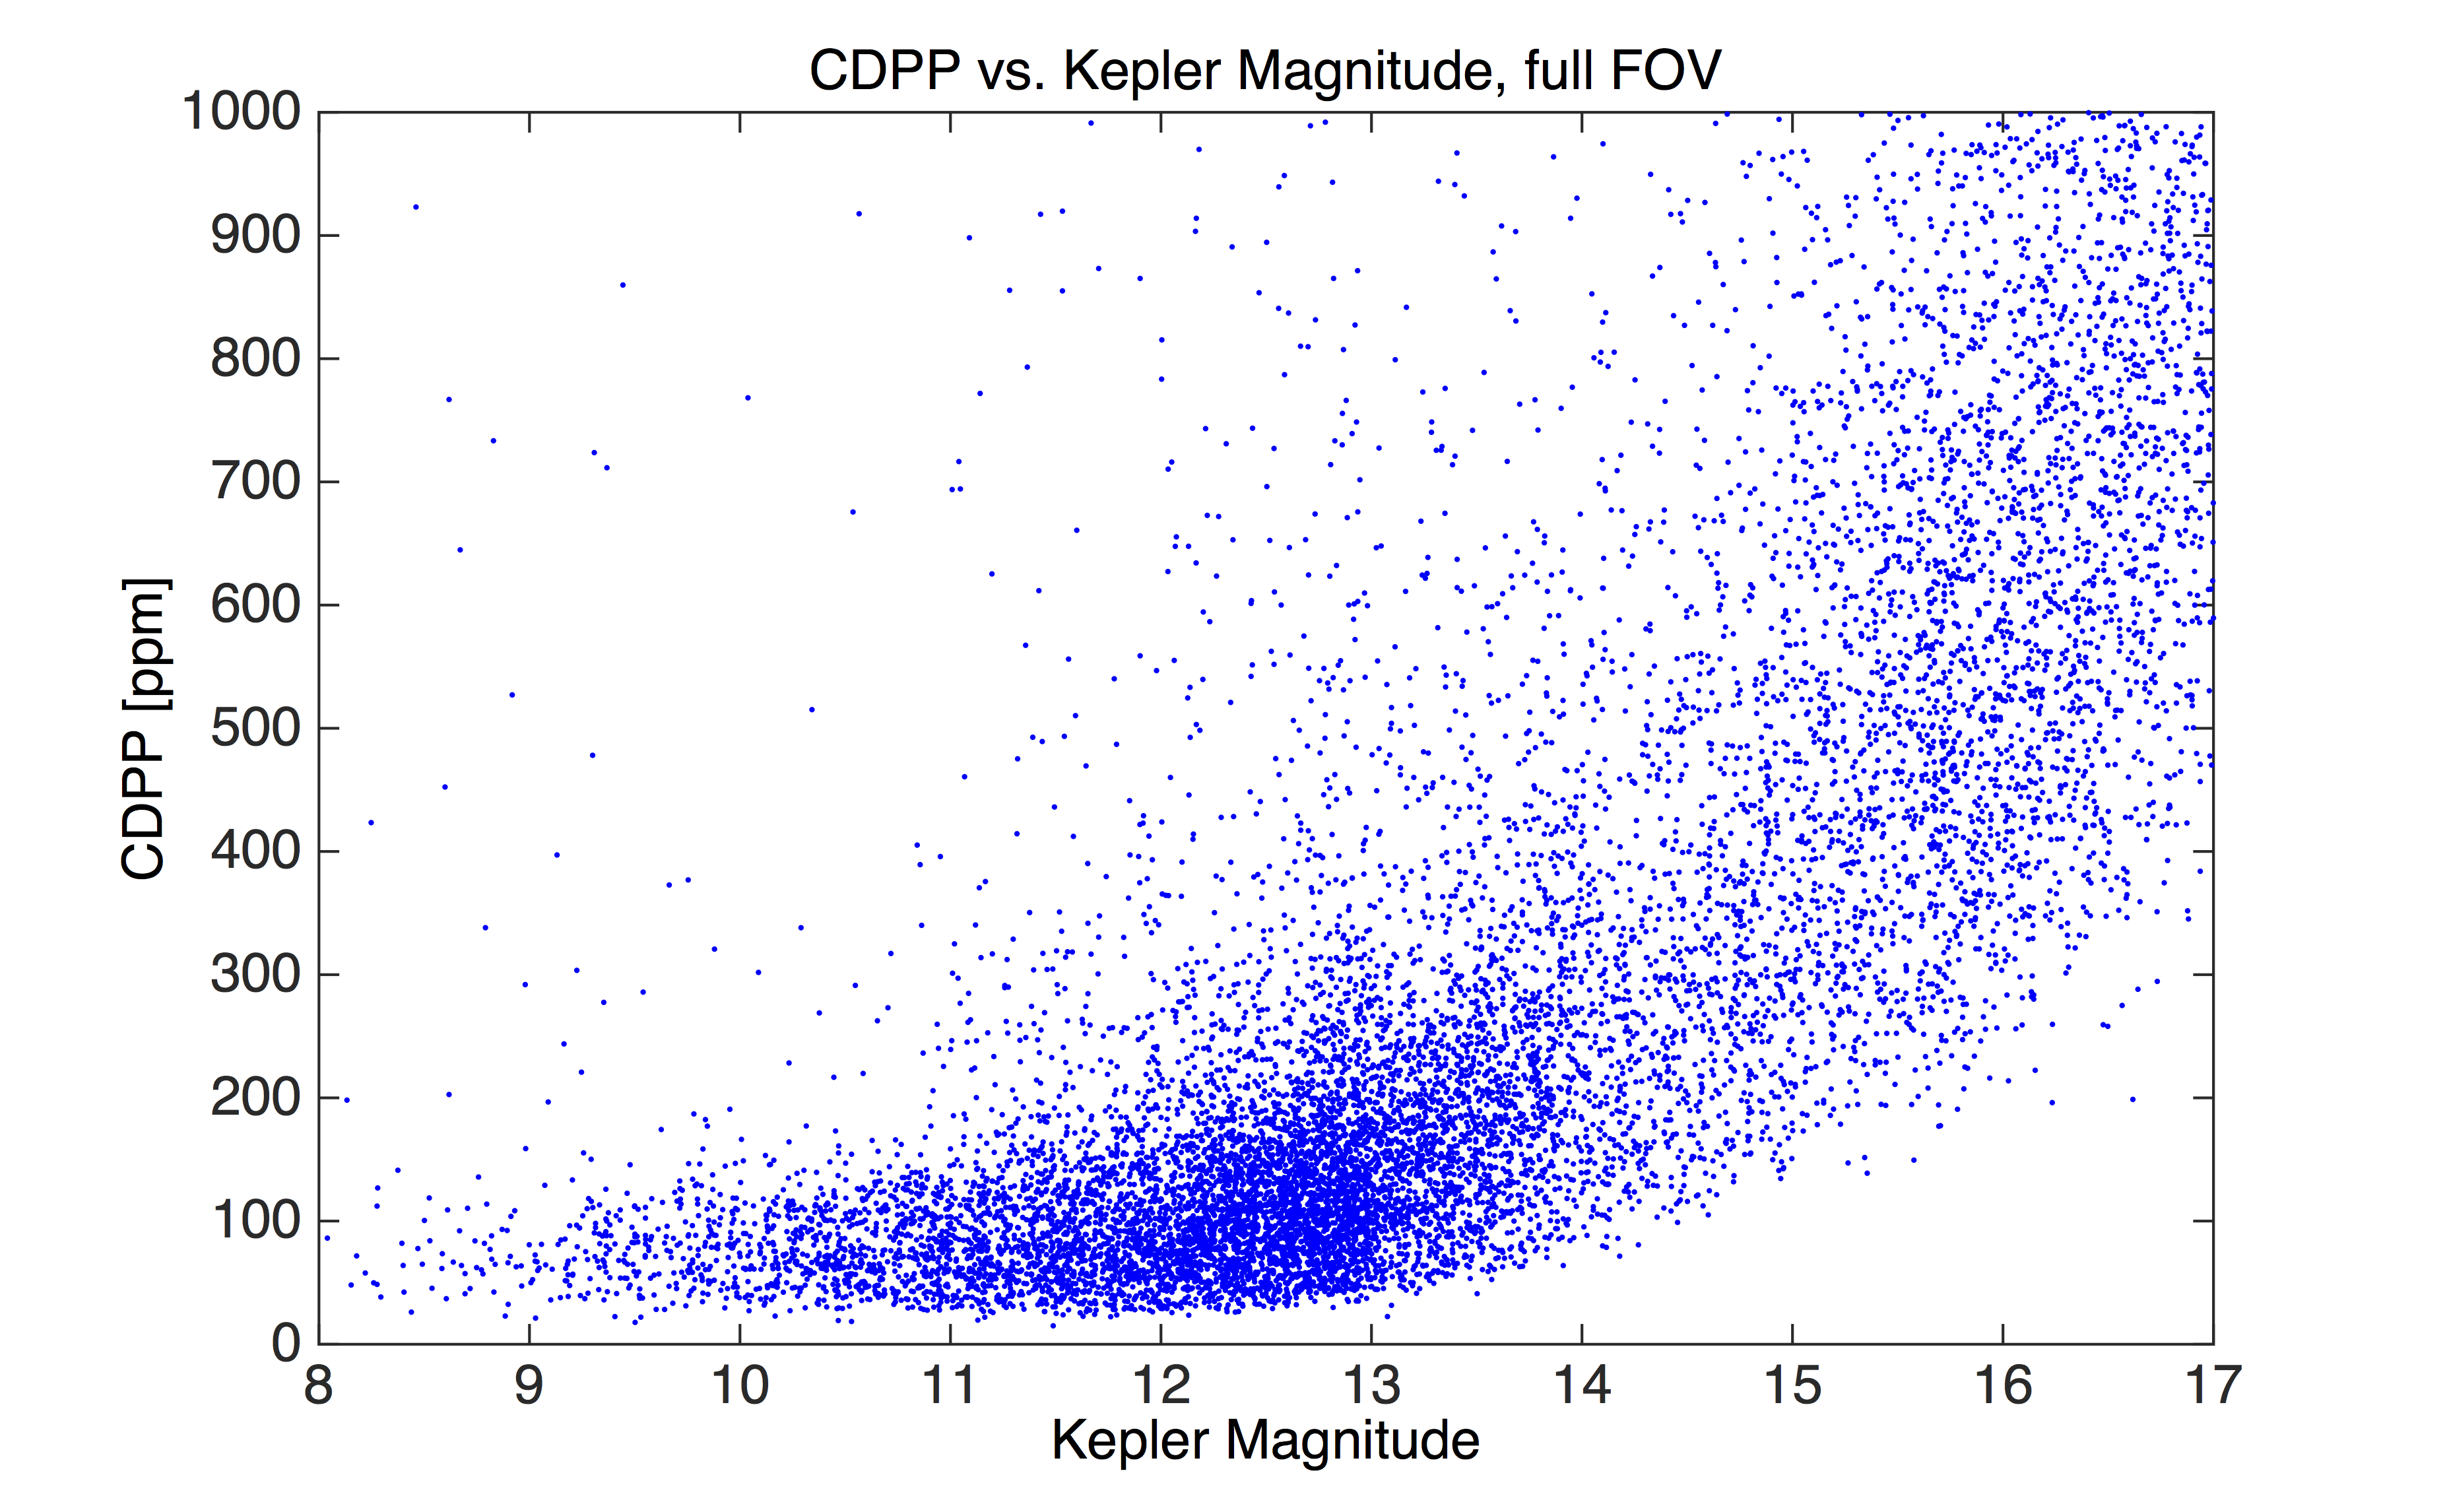
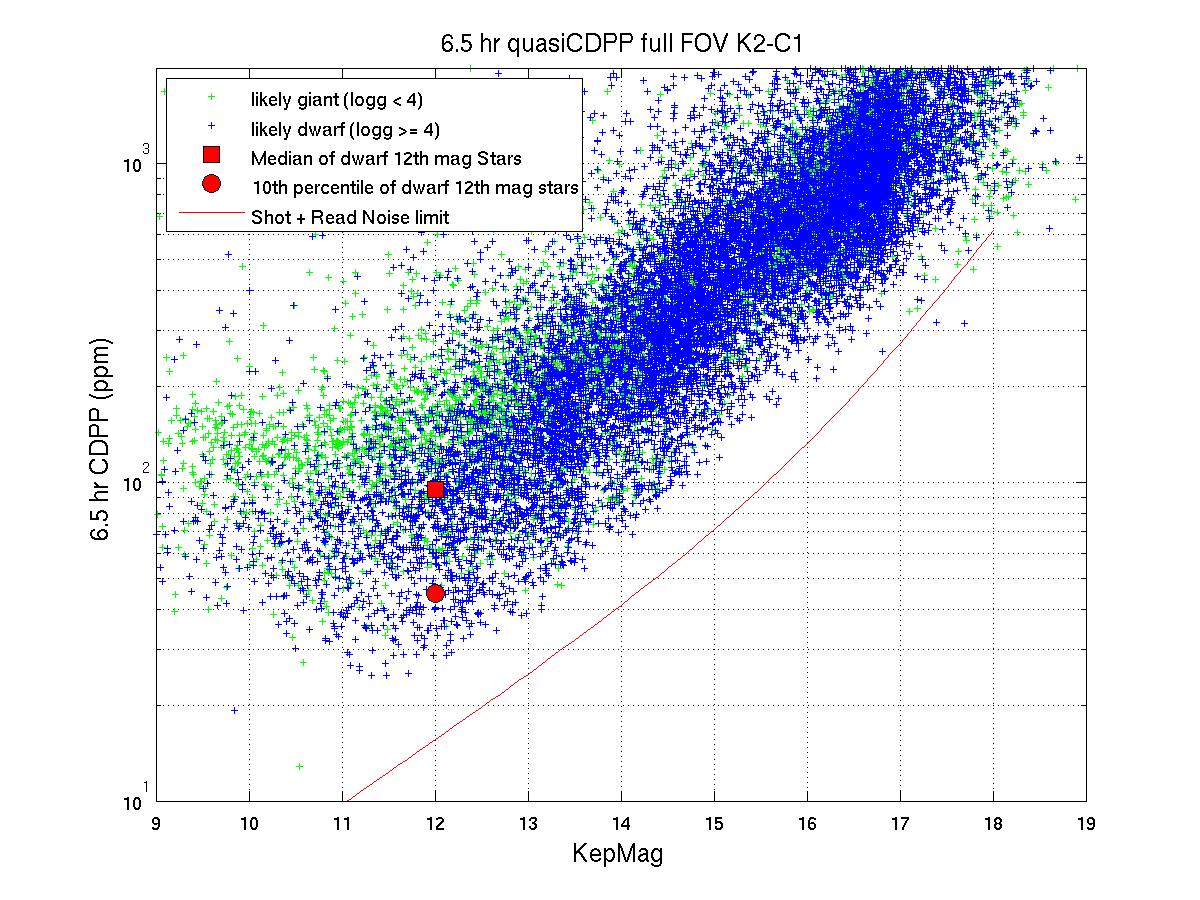
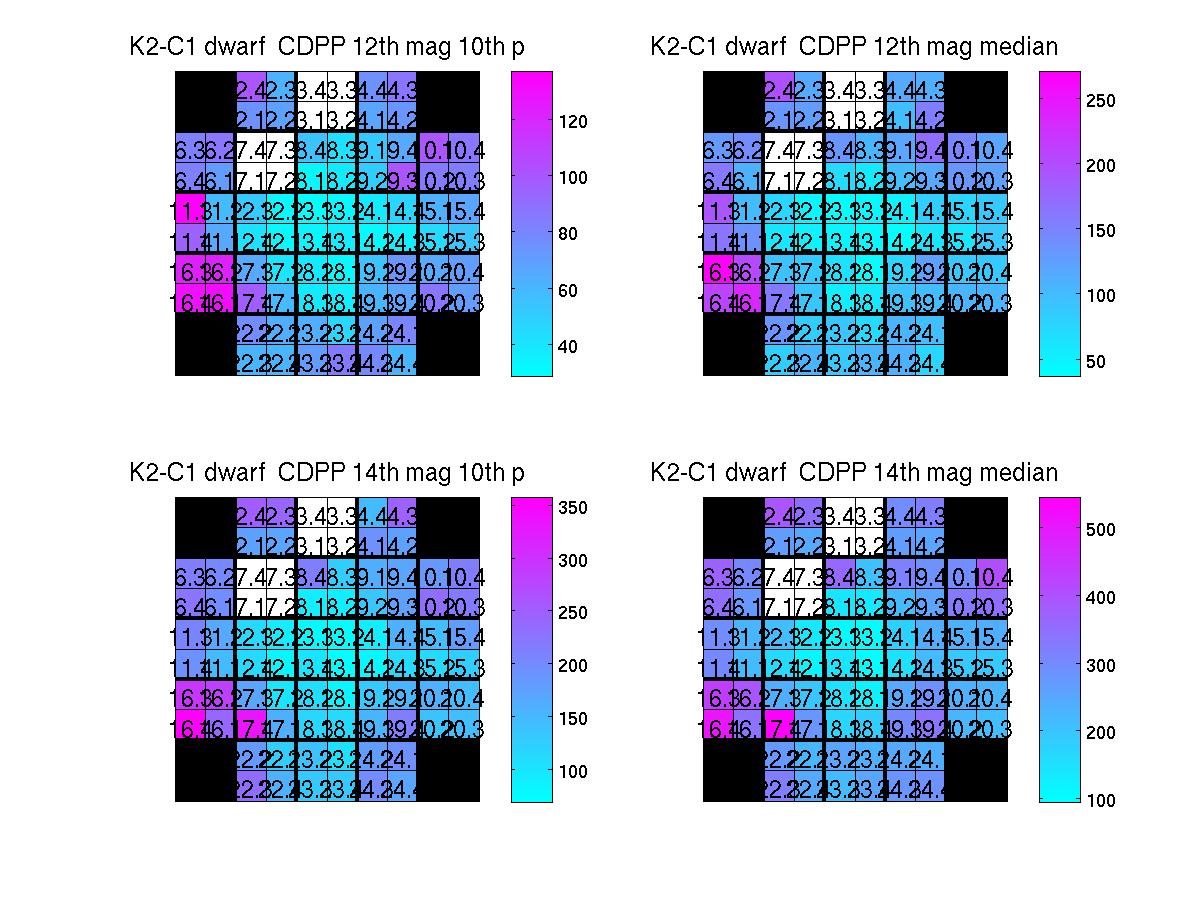
As in previous campaigns, the 6-hour spacecraft roll cycle continues to dominate the systematic errors in C14 simple aperture photometry light curves. The pipeline CDPP 12th magnitude noise benchmark for C14 is the lowest seen since C6. It is comparable to that seen in early campaigns with similar star density (C6, C8, C10), but is well below that seen in C12, also with similar star density. We do not have a definitive cause the for the improved precision, but it could be in part due to the relatively low star density and the return to more stable pointing (compared to recent campaigns).
The magnitude dependence of CDPP and its distribution over the focal
plane are shown below. Other CDPP benchmarks can be found in the
table giving 6.5-hr CDPP as a function of magnitude.
Targets Missing from the Archive
Pipeline errors during the process of exporting the light curve (LCV) and target pixel (TP) FITS files resulted in two targets (EPIC IDs 248463890 and 248463977) from C14 having no LCV or TPF files at the archive.
K2 Campaign 13 (Archived)
At a glance
- RA: 72.7971166 degrees
- Dec: 20.7870759 degrees
- Roll: -172.7995758 degrees
- 26,242 long cadence (LC) targets, including 21,434 standard LC stellar (or point-like) targets
- 118 short cadence (SC) targets, with 144 target definitions
- 15 moving objects were tiled with LC custom strip apertures. 33 bright stars, including Aldebaran, were assigned 40-pixel diameter LC disk apertures to capture the point spread function wings. Nine bright Hyades cluster stars were assigned 24-pixel diameter SC disk apertures. See the csv file that maps the custom aperture number to the target name.
- ktwo2017079075530-c13_ffi-cal.fits Note: only one FFI was collected during C13.
- Start Time: 2017-03-08 01:35:06 UTC
- Long Cadence Number: 140878
- Short Cadence Number: 4214800
- End Time: 2017-05-27 15:44:53 UTC
- Long Cadence Number: 144821
- Short Cadence Number: 4333119
Features and Events
Clusters and Star Forming Regions
The C13 field of view encompasses part of the Taurus star forming region, including the well known T-Tauri stars HL Tau (EPIC 210690913) and LkCa 15 (EPIC 247520207). The field of view also covers a portion of the Hyades star cluster along with the distant clusters NGC 1647, NGC 1746, and NGC 1817.
Galaxies
There are 33 galaxies targeted in the C13 field of view.
Pointing and Roll Performance
The C13 pointing and roll behavior are within the limits of that seen in other K2 campaigns for the majority of the campaign. The pipeline calculated maximum distance between the derived and nominal positions for any target (the "maximum attitude residual", or MAR) for C13 is well under the 3-pixel limit accommodated by the aperture halos, except for three periods with anomalous thruster firings. One is in the first day of the campaign lasting for 6 hours starting at 2017-03-08 17:46:06 UTC (cadence numbers 140911-140922). Two periods of anomalous pointing occur in the final five days of the campaign: 18 hours starting at 2017-05-23 12:11:44 UTC (cadence numbers 144619-144654), and 6 hours starting at 2017-05-25 11:16:28 UTC (cadence numbers 144715-144726). These anomalous thruster firing events occurring near the start and end of campaigns are suspected to be due to low fuel levels. The flight team is investigating them in an effort to understand whether they can be mitigated and how they might evolve in future campaigns.

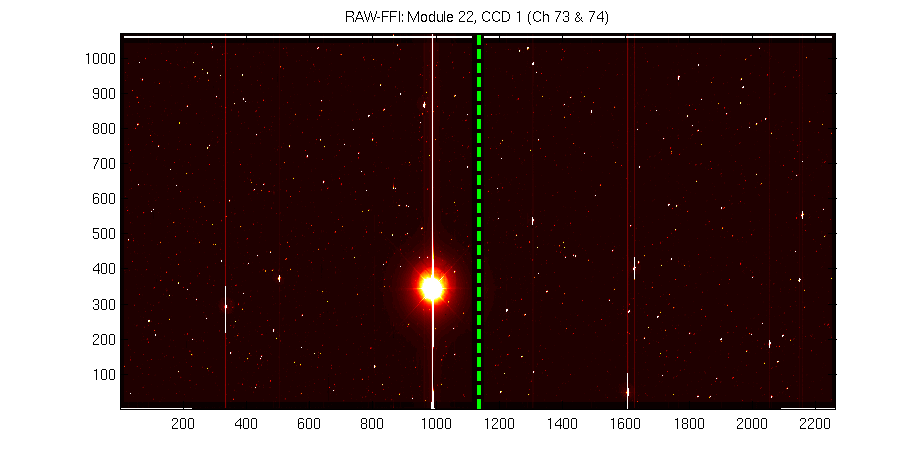
Smear Correction Error on Channel 74
The presence of the first magnitude star Aldebaran on channel 73 led to an error in the smear correction for channel 74, which shares the same physical CCD (see figure Aldebaran). The saturated charge from Aldebaran spills over all rows of the image and into the serial register of the CCD, corrupting the first three rows of the masked smear region in the FFI. While these rows are not used for the smear correction, at times during C13 the saturation spill covered more rows in the masked smear, extending up to row 15 on channel 74 (see figure Channel 74 Trailing Black). Trailing black rows 7-18 are fit with a linear model to estimate the black (bias) level for the masked smear region.
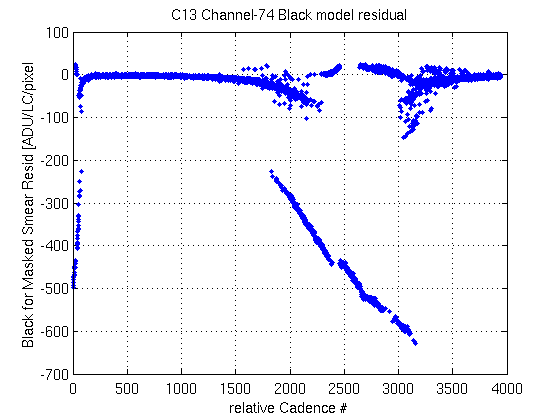
At these times, the trailing black estimate for the masked smear signal was corrupted, resulting in a corrupted smear measurement for the affected cadences. Since the smear signal is subtracted from all the pixels in the channel, all targets on channel 74 were affected for these cadences. The impact is somewhat mitigated by background correction, but due to the non-linearity correction during calibration, a residual error remains. The effect is generally more significant for faint targets; however, users are cautioned to estimate the impact on their science of using data from the affected cadences. In addition, due to the rapidly changing background estimate, the argabrightening detector (see Kepler Data Characteristics Handbook, Sec 5.8) was triggered on channel 74 resulting in data gaps in the light curve files for some targets. Users should treat the channel specific argabrightening indicator in QUALITY and SAP_QUALITY flags with caution (bit 13, decimal=4096).
The smear corruption effects were most prominent in the first 80 cadences of the campaign and again in the period between cadence 1800-3200 (see Figure Channel 74 Trailing Black) In order to allow users to select the cadences they wish to exclude, the attached csv file c13_ch74_black_for_smear_residuals.csv contains the residual black level for the masked smear pixels after model fitting for each LC. The units of the residual signal are ADU/LC/pixel. The cadences with large negative residuals (<-200 ADU/LC/pixel) and those showing bimodal behavior are indicative of a poor model fit and a corrupted smear correction.

Data Quality and Processing Notes
Light Curve Quality
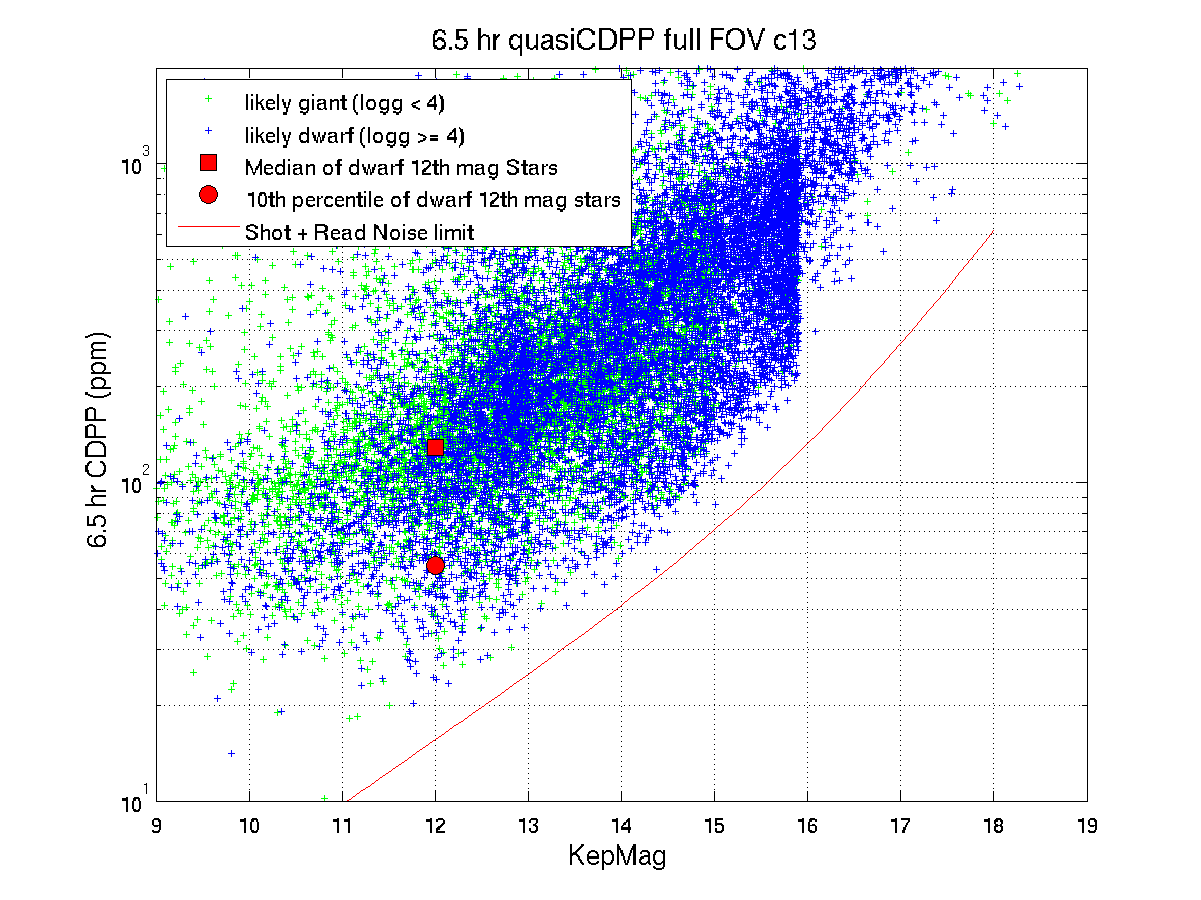
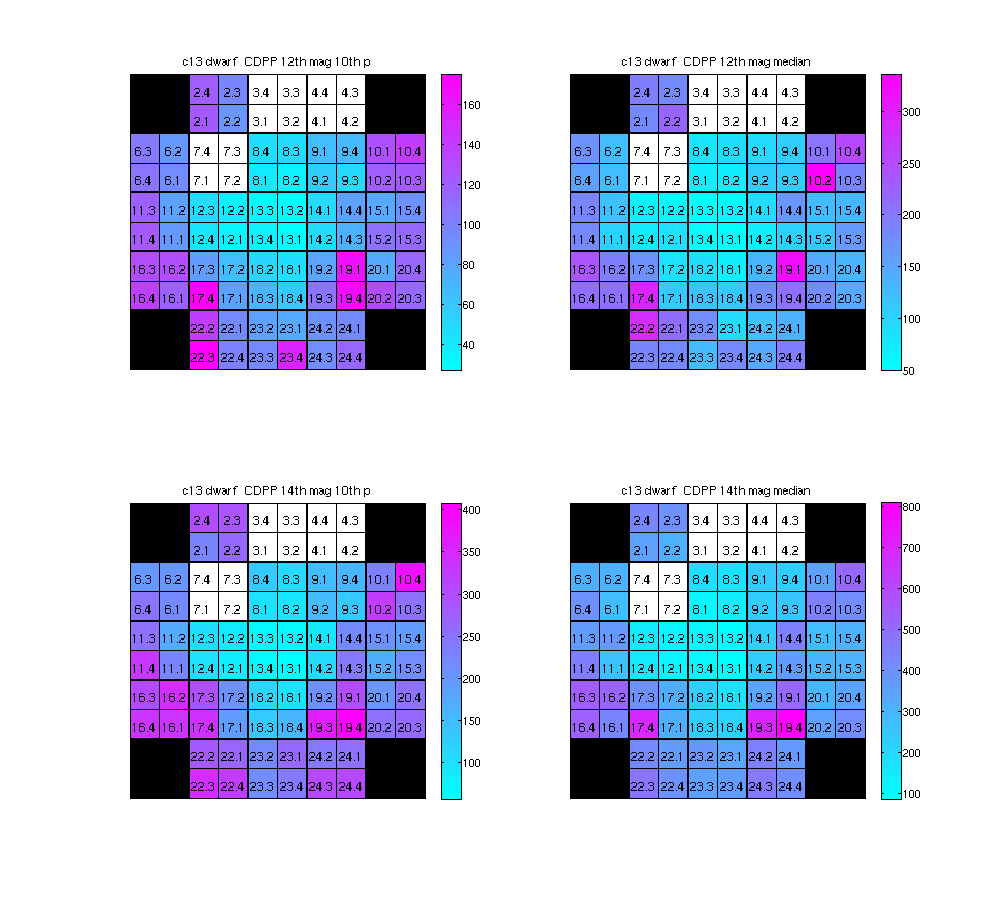
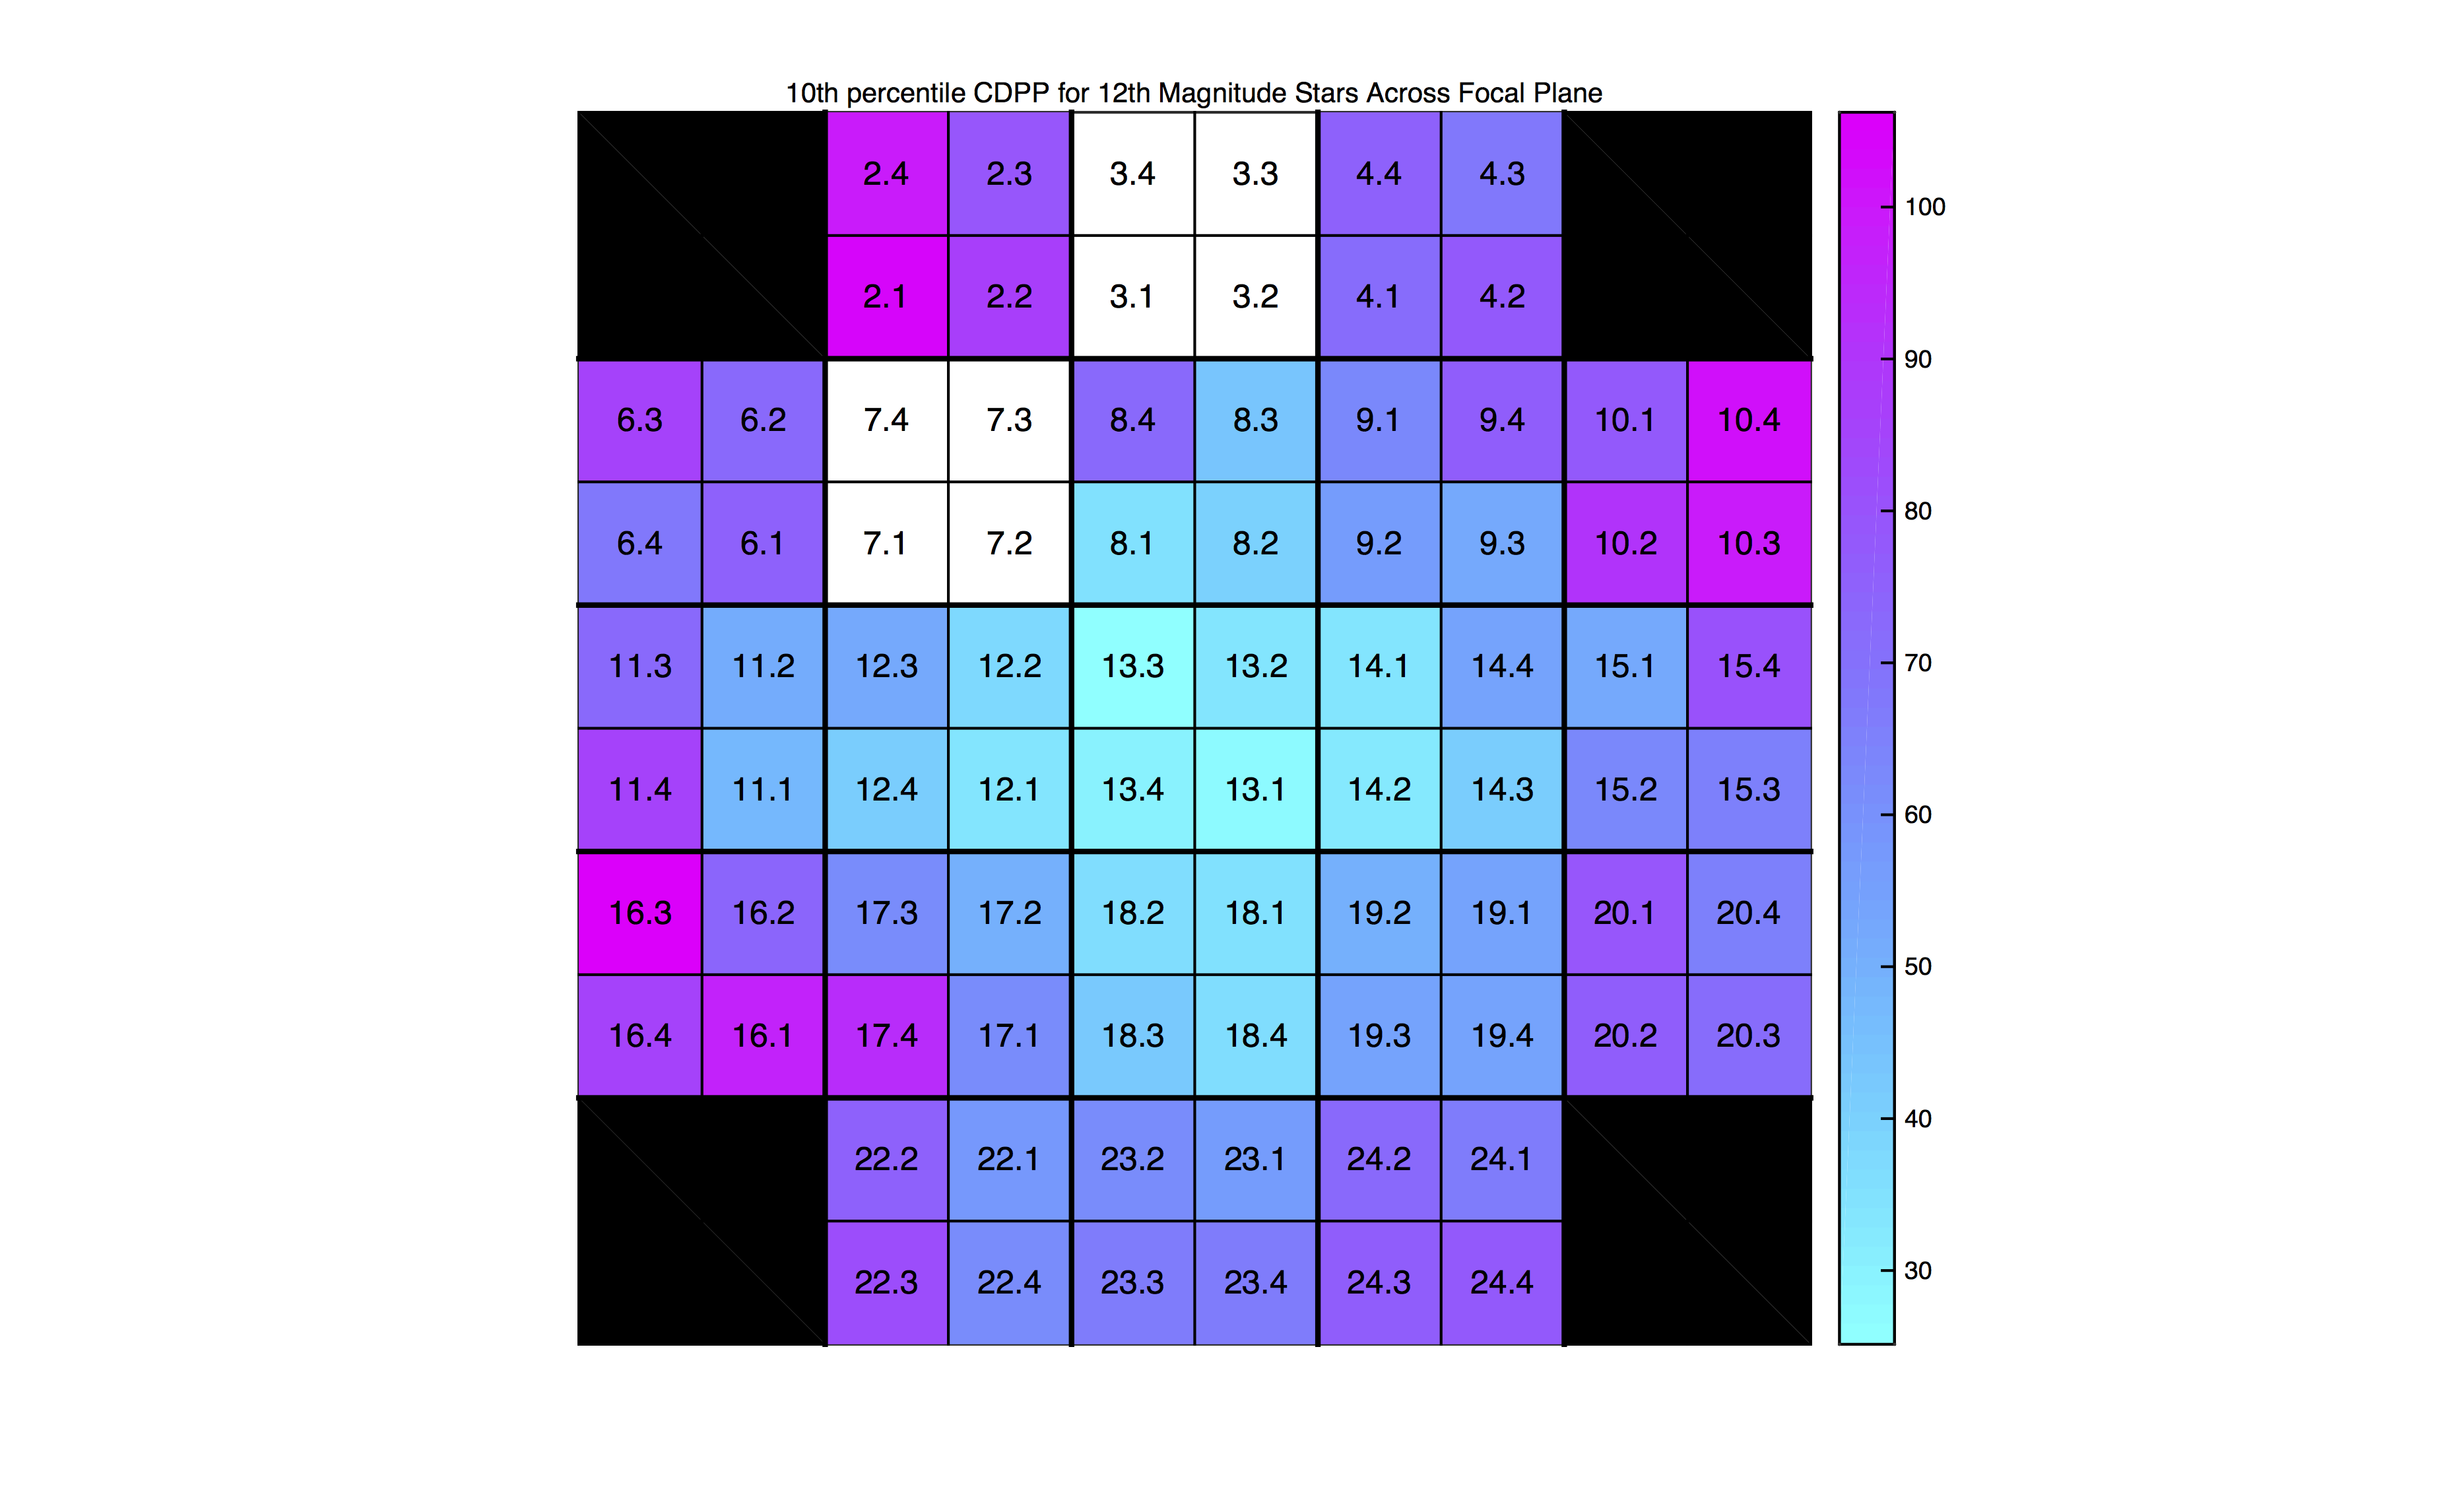
As in previous campaigns, the 6-hour spacecraft roll cycle continues to dominate the systematic errors in C13 simple aperture photometry light curves. Similar to C12, the pipeline CDPP 12th magnitude noise benchmark is 15-20% higher than what was seen in star fields of comparable star density (e.g. C4, C5). There is tentative evidence that at least part of this increase is due to the anomalous pointing excursions at the beginning and end of the campaign. In future campaigns, the processing will exclude such cadences from PDC and from the CDPP estimates.
The magnitude dependence of CDPP and its distribution over the focal
plane are shown below. Other CDPP benchmarks can be found in the
table giving 6.5-hr CDPP as a function of magnitude.
K2 Campaign 12 (Archived)
At a glance
- RA: 351.6588124 degrees
- Dec: -5.1023328 degrees
- Roll: -156.8808419 degrees
- 45,951 EPIC IDs in long cadence (LC).
- 234 EPIC IDs in short cadence (LC).
- 42 unique LC custom targets were selected, along with two SC custom target apertures for Chiron and Trappist-1. See the csv file that maps the custom aperture number to the target name.
- Start Time: 2016-12-15 20:40:49 UTC
- Long Cadence Number:136855
- Short Cadence Number: 4094110
- End Time: 2017-03-04 18:37:47 UTC
- Long Cadence Number: 140716
- Short Cadence Number: 4209969
Features and Events
Mars
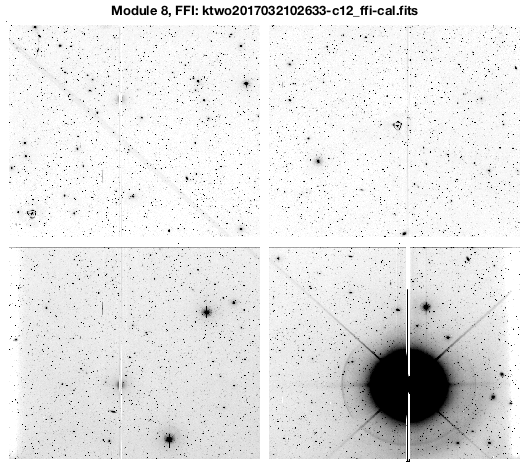
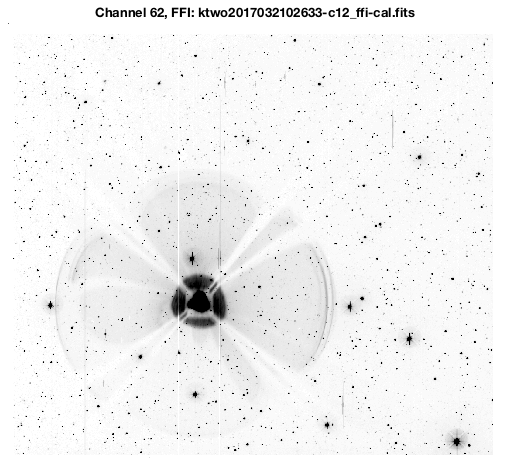
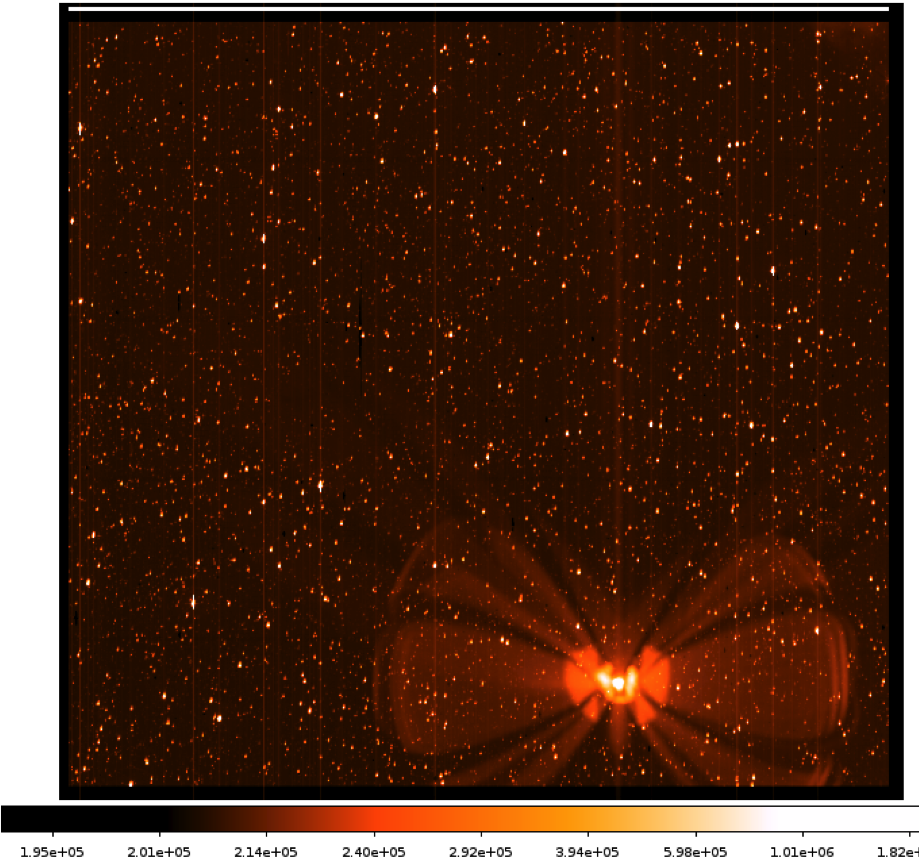
Mars passed through the focal plane during C12, entering active silicon on module 24 output 3 (channel 83) on 2017-01-16 (relative cadence index 1550) and moving off of module 3 output 4 (dead channel 8) on 2017-02-09 (relative cadence index 2728). The movie C12-Mars-at-LC below shows the direct image of Mars passing over channel 83. With an average visual magnitude of V ~ -0.2, the image of Mars is highly saturated, introduces significant scattered light, and creates a video crosstalk signal in each of the other three channels of the module on which it falls. In addition, there is a ghost image of Mars caused by reflection off of the field-flattener lens and CCD then off of the Schmidt correcter and back to the focal plane. This ghost image appears approximately on the opposite side of the boresight from the direct Mars image. An example of the direct image with crosstalk and the ghost image is shown in the figures below (C12-Module-8 Mars FFI Image, C12-Channel-62 Mars Ghost Image) taken from the second FFI: ktwo2017032102633-c12_ffi-cal.fits.
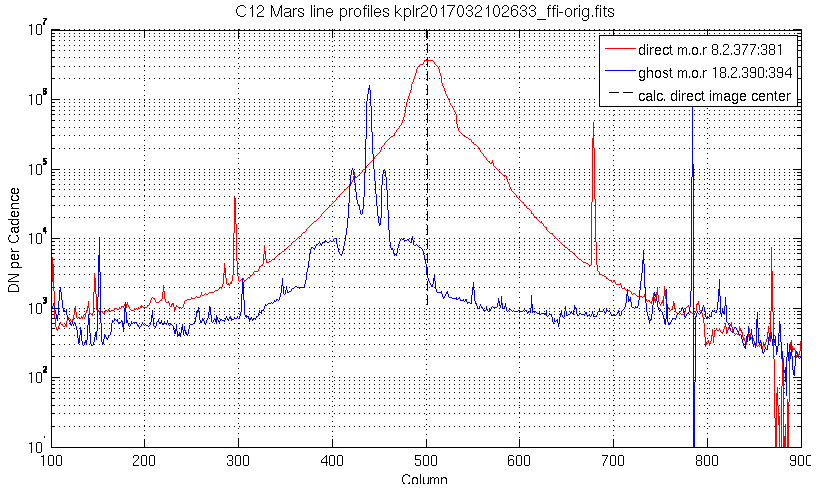
A more quantitative understanding of the signals from Mars can be gained from the raw flux profiles below of Mars and its ghost image, taken from the same FFI. The profile shows a slice through the direct image for a rough guide to the azimuthally-averaged part of the image. Note that the saturation spills across all CCD rows for the central columns of the Mars image and the diffraction spikes extend over multiple channels. Spikes in the profile plot are caused by stray stars. Users should also note that the median rate of motion of Mars is 11 pixels per Long Cadence.
For users wishing to have a better idea when Mars may have affected the data from particular targets, pipe-delimited text files for the path of Mars c12_mars_direct.txt and its ghost c12_mars_ghost.txt during the middle of C12 have been generated using the JPL Horizons website. The location of Mars was calculated from the Kepler-o-centric (NAIF Id = -227) RA and DEC. The location of Mars and its ghost in the FFI are in the headers of the respective files.
The location of the ghost was calculated by rotating the RA and DEC of Mars around the boresight by 180 degrees and is approximate due to variations of the CCD and field-flattener lens positions and orientations from the ideal focal plane. Based on the FFI and the long cadence pixel data, the ghost can vary in position by up to ~100 pixels from the locations given in the table. Given this variation and the large size of the ghost image, users might be advised to use caution if their target is within 200 pixels from the (predicted) ghost image and 350 pixels from the direct image of Mars.
Galaxies
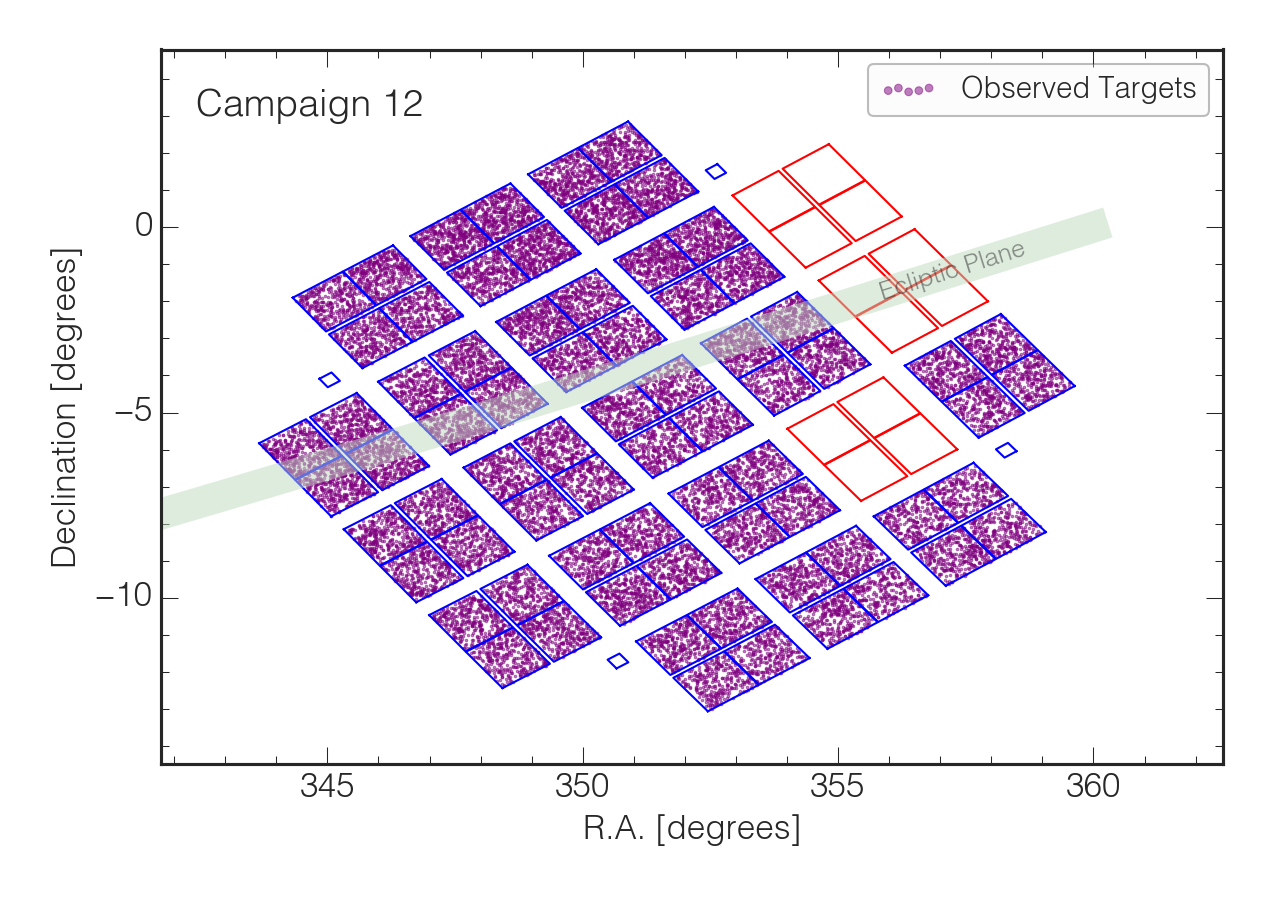
There are 2576 galaxies targeted in the high Galactic latitude (-60º) C12 field of view.
Pointing and Roll Performance
The C12 pointing and roll behavior are within the limits of that seen in other K2 campaigns for the majority of the campaign. The pipeline calculated maximum distance between the derived and nominal positions for any target (the "maximum attitude residual", or MAR) for C12 is well under the 3-pixel limit accommodated by the aperture halos, except for one 6-hour period starting at 2017-03-03 19:05:24 near the end of the campaign. Cadence numbers 140670-140681 have a roll error of more than -50 arcseconds, though roll performance returned to normal at the subsequent thruster firing and remained nominal for the rest of the campaign.

Safe Mode and Loss of Engineering Data On 2017-02-01 15:06 UTC the spacecraft entered safe mode. The safe mode was likely due to a flight software reset, which has occurred several times during the Kepler/K2 mission. The recovery from this safe mode was routine and the spacecraft resumed science data collection at 2017-02-06 20:47 UTC. The total time lost to this safe mode was 5.3 days.
In order to minimize the science data loss, the project decided not to downlink stored engineering data during during the safe mode recovery. This decision resulted in the loss of ~10 days of engineering data, starting 2017-01-25 08:16 UTC and extending into the safe mode. No stored science data were lost. The engineering data includes the thruster firing data, so there is no thruster firing information from the spacecraft for this time period. In order to fill in the thruster firing information in the archive data files, we used the short cadence pointing history to detect likely thruster firings during the data gap. If the thruster firing could be unambiguously identified within a SC interval, a thruster firing was flagged in the QUALITY and SAP_QUALITY fields (bit 21). If the thruster firing appeared to span SC intervals, both intervals would be flagged with a possible thruster firing (bit 20). Users should be alert to possible missed thruster firings in the interval from 2017-01-25 08:16 UTC to the start of the safe mode at 2017-02-01 15:06 UTC.
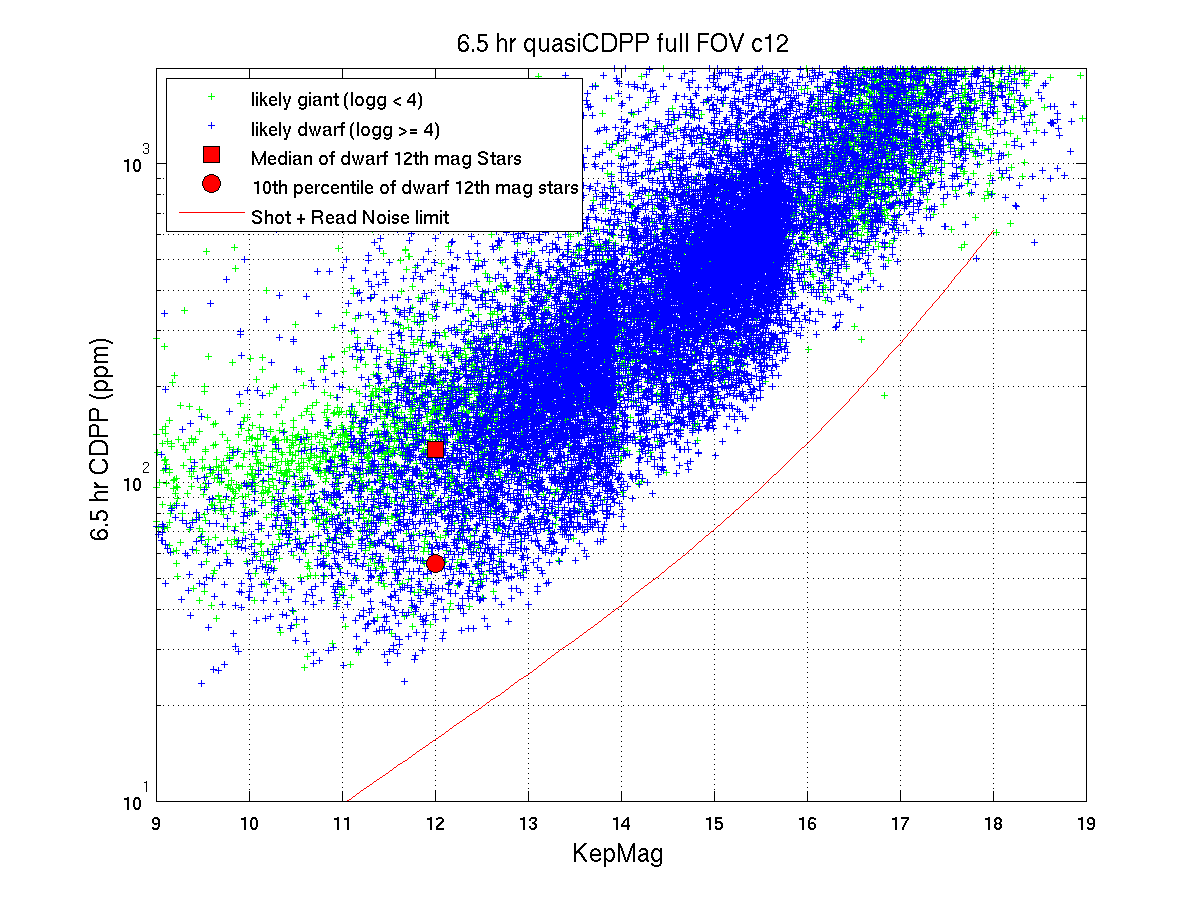
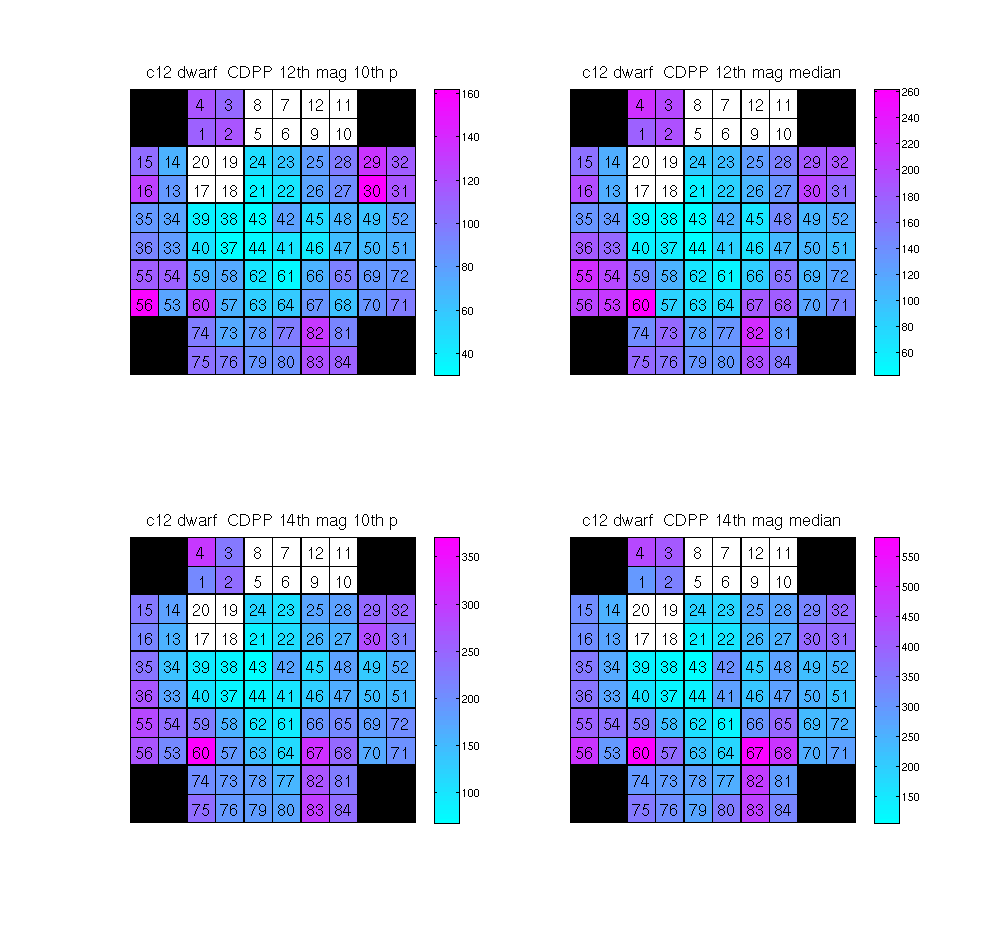
Data Quality and Processing Notes
Light Curve Quality
As in previous campaigns, the 6-hour spacecraft roll cycle continues to dominate the systematic errors in C12 simple aperture photometry light curves. In spite of the sparse nature of the C12 field of view, the pipeline CDPP 12th magnitude noise benchmark is 20% higher than what was seen in star fields of comparable star density (55 ppm in C12 vs 42 ppm in C6 and 47 ppm in C8). The passage of Mars most significantly affected CDPP on the channels with the direct and ghost images; however, excluding these channels does not lower the 12th magnitude CDPP benchmark value. The project is investigating this performance change to better understand the change in CDPP as a function of magnitude, position, color, etc., and to see if it can be traced to a spacecraft, or a pipeline processing change.
The magnitude dependence of CDPP and its distribution over the focal
plane are shown below. Other CDPP benchmarks can be found in the
table giving 6.5-hr CDPP as a function of magnitude.
K2 Campaign 11 (Archived)
At a glance
Campaign 11 was operationally separated into two segments as a result of an error in the initial roll-angle used to minimize solar torque on the spacecraft. The larger than expected roll motion seen at the start of the campaign meant that the targets would be rolling out of their pixel apertures by the end of the campaign. The excess roll motion was corrected twenty-three days into the campaign by applying a -0.32º roll offset. The size of this correction meant that new target aperture definitions had to be used for the second part of the campaign. The two segments are identified in the archive products as C111 and C112, respectively.
C11a Pointing- RA: 260.3880064 degrees
- Dec: -23.9759578 degrees
- Roll: 176.7437075 degrees
- RA: 260.3880064 degrees
- Dec: -23.9759578 degrees
- Roll: 176.4237075 degrees
- delta-RA: 0.0 degrees
- delta-Dec: 0.0 degrees
- delta-Roll: -0.32 degrees
- Time: 2016-09-24 19:12:30 UTC
- Long Cadence Number: 132839
- Short Cadence Number: 3973630
- Time: 2016-10-18 02:16:19 UTC
- Long Cadence Number: 133979
- Short Cadence Number: 4007859
- Time: 2016-10-21 06:17:05 UTC
- Long Cadence Number: 134134
- Short Cadence Number: 4012480
- Time: 2016-12-07 23:23:03 UTC
- Long Cadence Number: 136469
- Short Cadence Number: 4082559
- 32884 (32580 in C11b) in long cadence (LC)
- 67 (66 in C11b) in short cadence (SC)
- 72 Custom targets include 64 Solar System moving objects tiled with multiple apertures, featuring Titan and Enceladus, 9 bright stars covered with disk apertures to capture the PSF wings, 22 late microlensing targets, and 5 galaxy targets. See the C11a csv file and C11b csv file to map the Solar system object custom aperture numbers to the target names.
- No new targets were added for C11b. Because of the change in roll attitude, the positions of all the target apertures on the focal plane were changed, causing some targets to move to a different detector channel and some to fall off active silicon. 304 long cadence targets and 1 short cadence target were dropped in C11b.
The two C11 FFIs were taken at the C11a and C11b pointings respectively. The -0.32 degree roll offset is evident when comparing the two images.
Most Recent Processing Version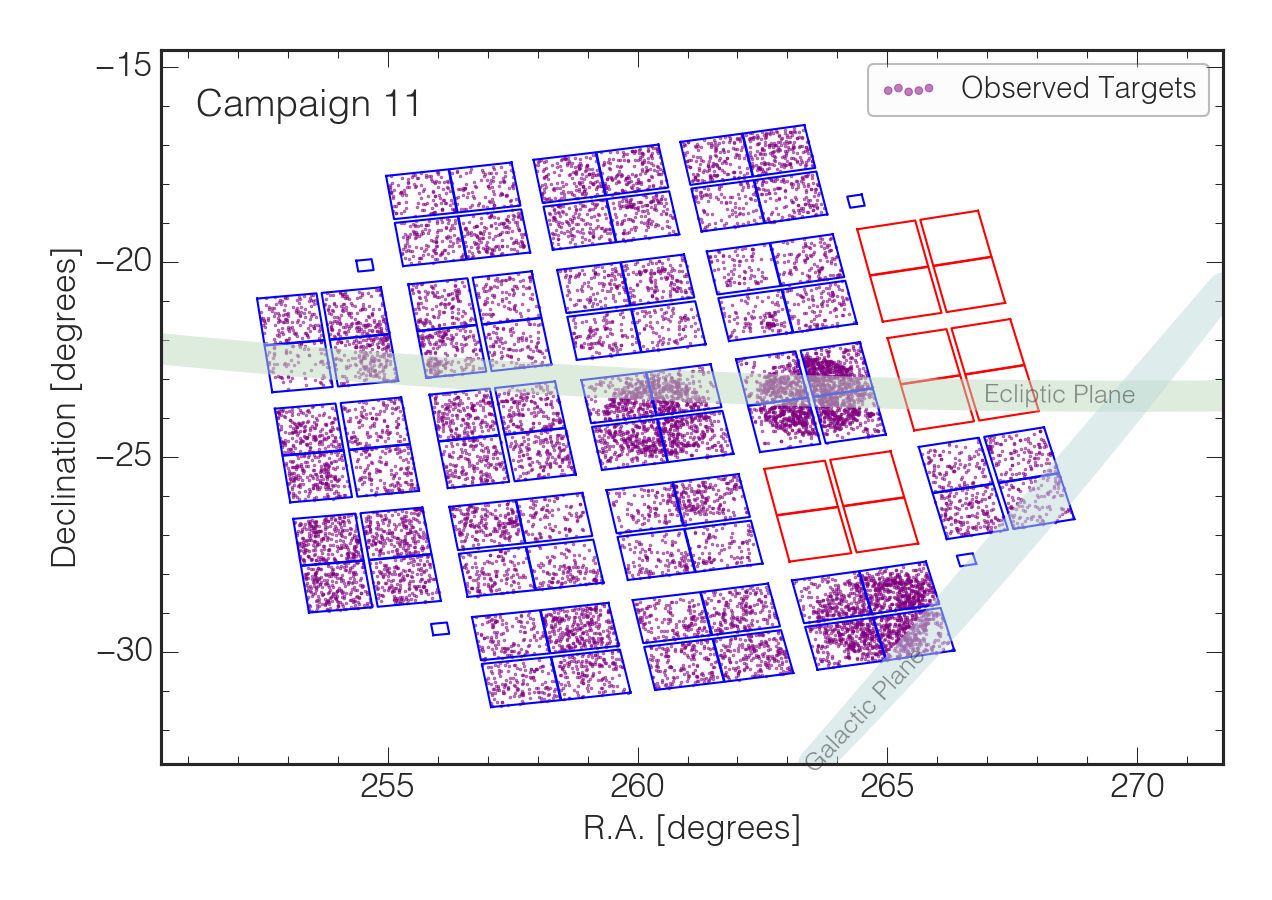
Features and Events
Galactic Bulge
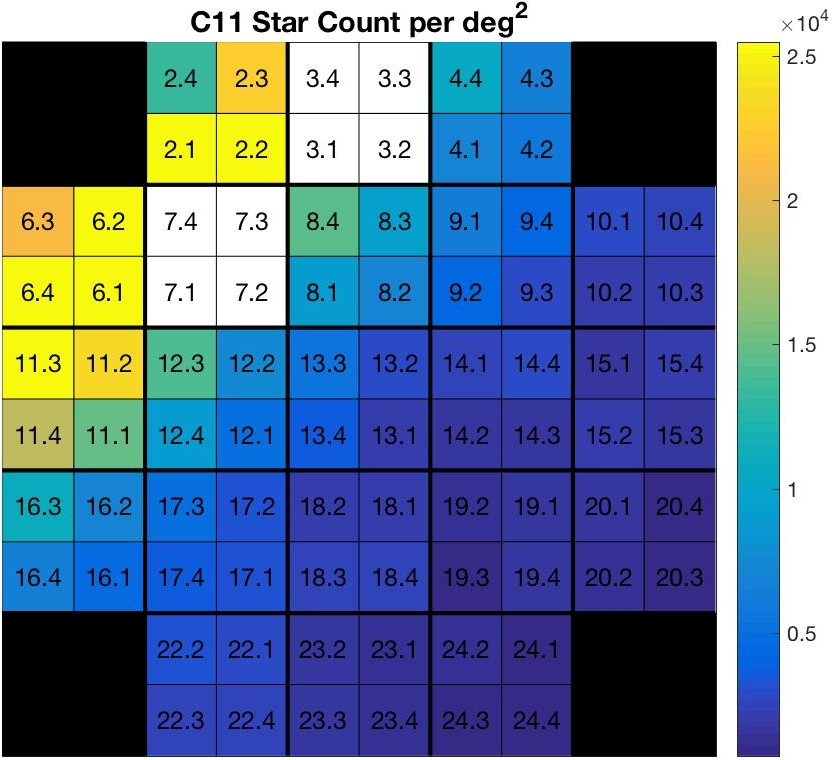
The C11 field of view is the densest star field for which pipeline light curves have been created. The average density of stars with magnitude 11.5 < Kp < 14.5 over the field of view is 6959 stars/deg^2. Detector channels covering the galactic bulge have densities as high as 25,000 stars/deg^2. For comparison the average density of stars in this magnitude range for the Kepler field of view is 900 stars/deg^2. As a result of the high star density, many of the pipeline algorithms are operating outside of their design range. Users are cautioned to treat the pipeline background, centroid, and aperture photometry results with care, especially on channels covering the Galactic Bulge.
Saturn
Saturn (V = +1) and its bright moons Titan (V = +9), and Enceladus (V = +12) entered channel 84 near the end of the campaign (Dec 3, ~12h UT) allowing ~4.5 days of observations. Titan is ~18 pixels away from Saturn, while Enceladus is only 2-4 pixels from Saturn and regularly passed through Saturn's saturated charge spill columns. Both Titan and Enceladus were tiled with custom aperture masks.
Attitude Offset and Segmenting of C11 Data
The spacecraft attitude was adjusted by -0.32º in roll on 2016-10-21 to correct the initial roll-offset error. Because this attitude offset was large enough to require new target pixel apertures, the C11 data were processed through the pipeline in two separate parts:
- the first 23 days of data, dubbed C11a
- the remaining 48 days of the campaign, dubbed C11b.
In some cases, the updated C11b target apertures extended off the edge of the active CCD and included rows of collateral smear, or columns of collateral black data. These collateral data are evident in the TPFs and should not be used when doing photometry on the target.


Pointing and Roll Performance
The C11a and C11b pointing and
roll behavior are within the limits of that seen in other K2 campaigns.
The pipeline calculated maximum distance between the
derived and nominal positions for any target (the "maximum attitude residual", or MAR)
for C11 is well under the 3-pixel limit accommodated by the aperture halos.
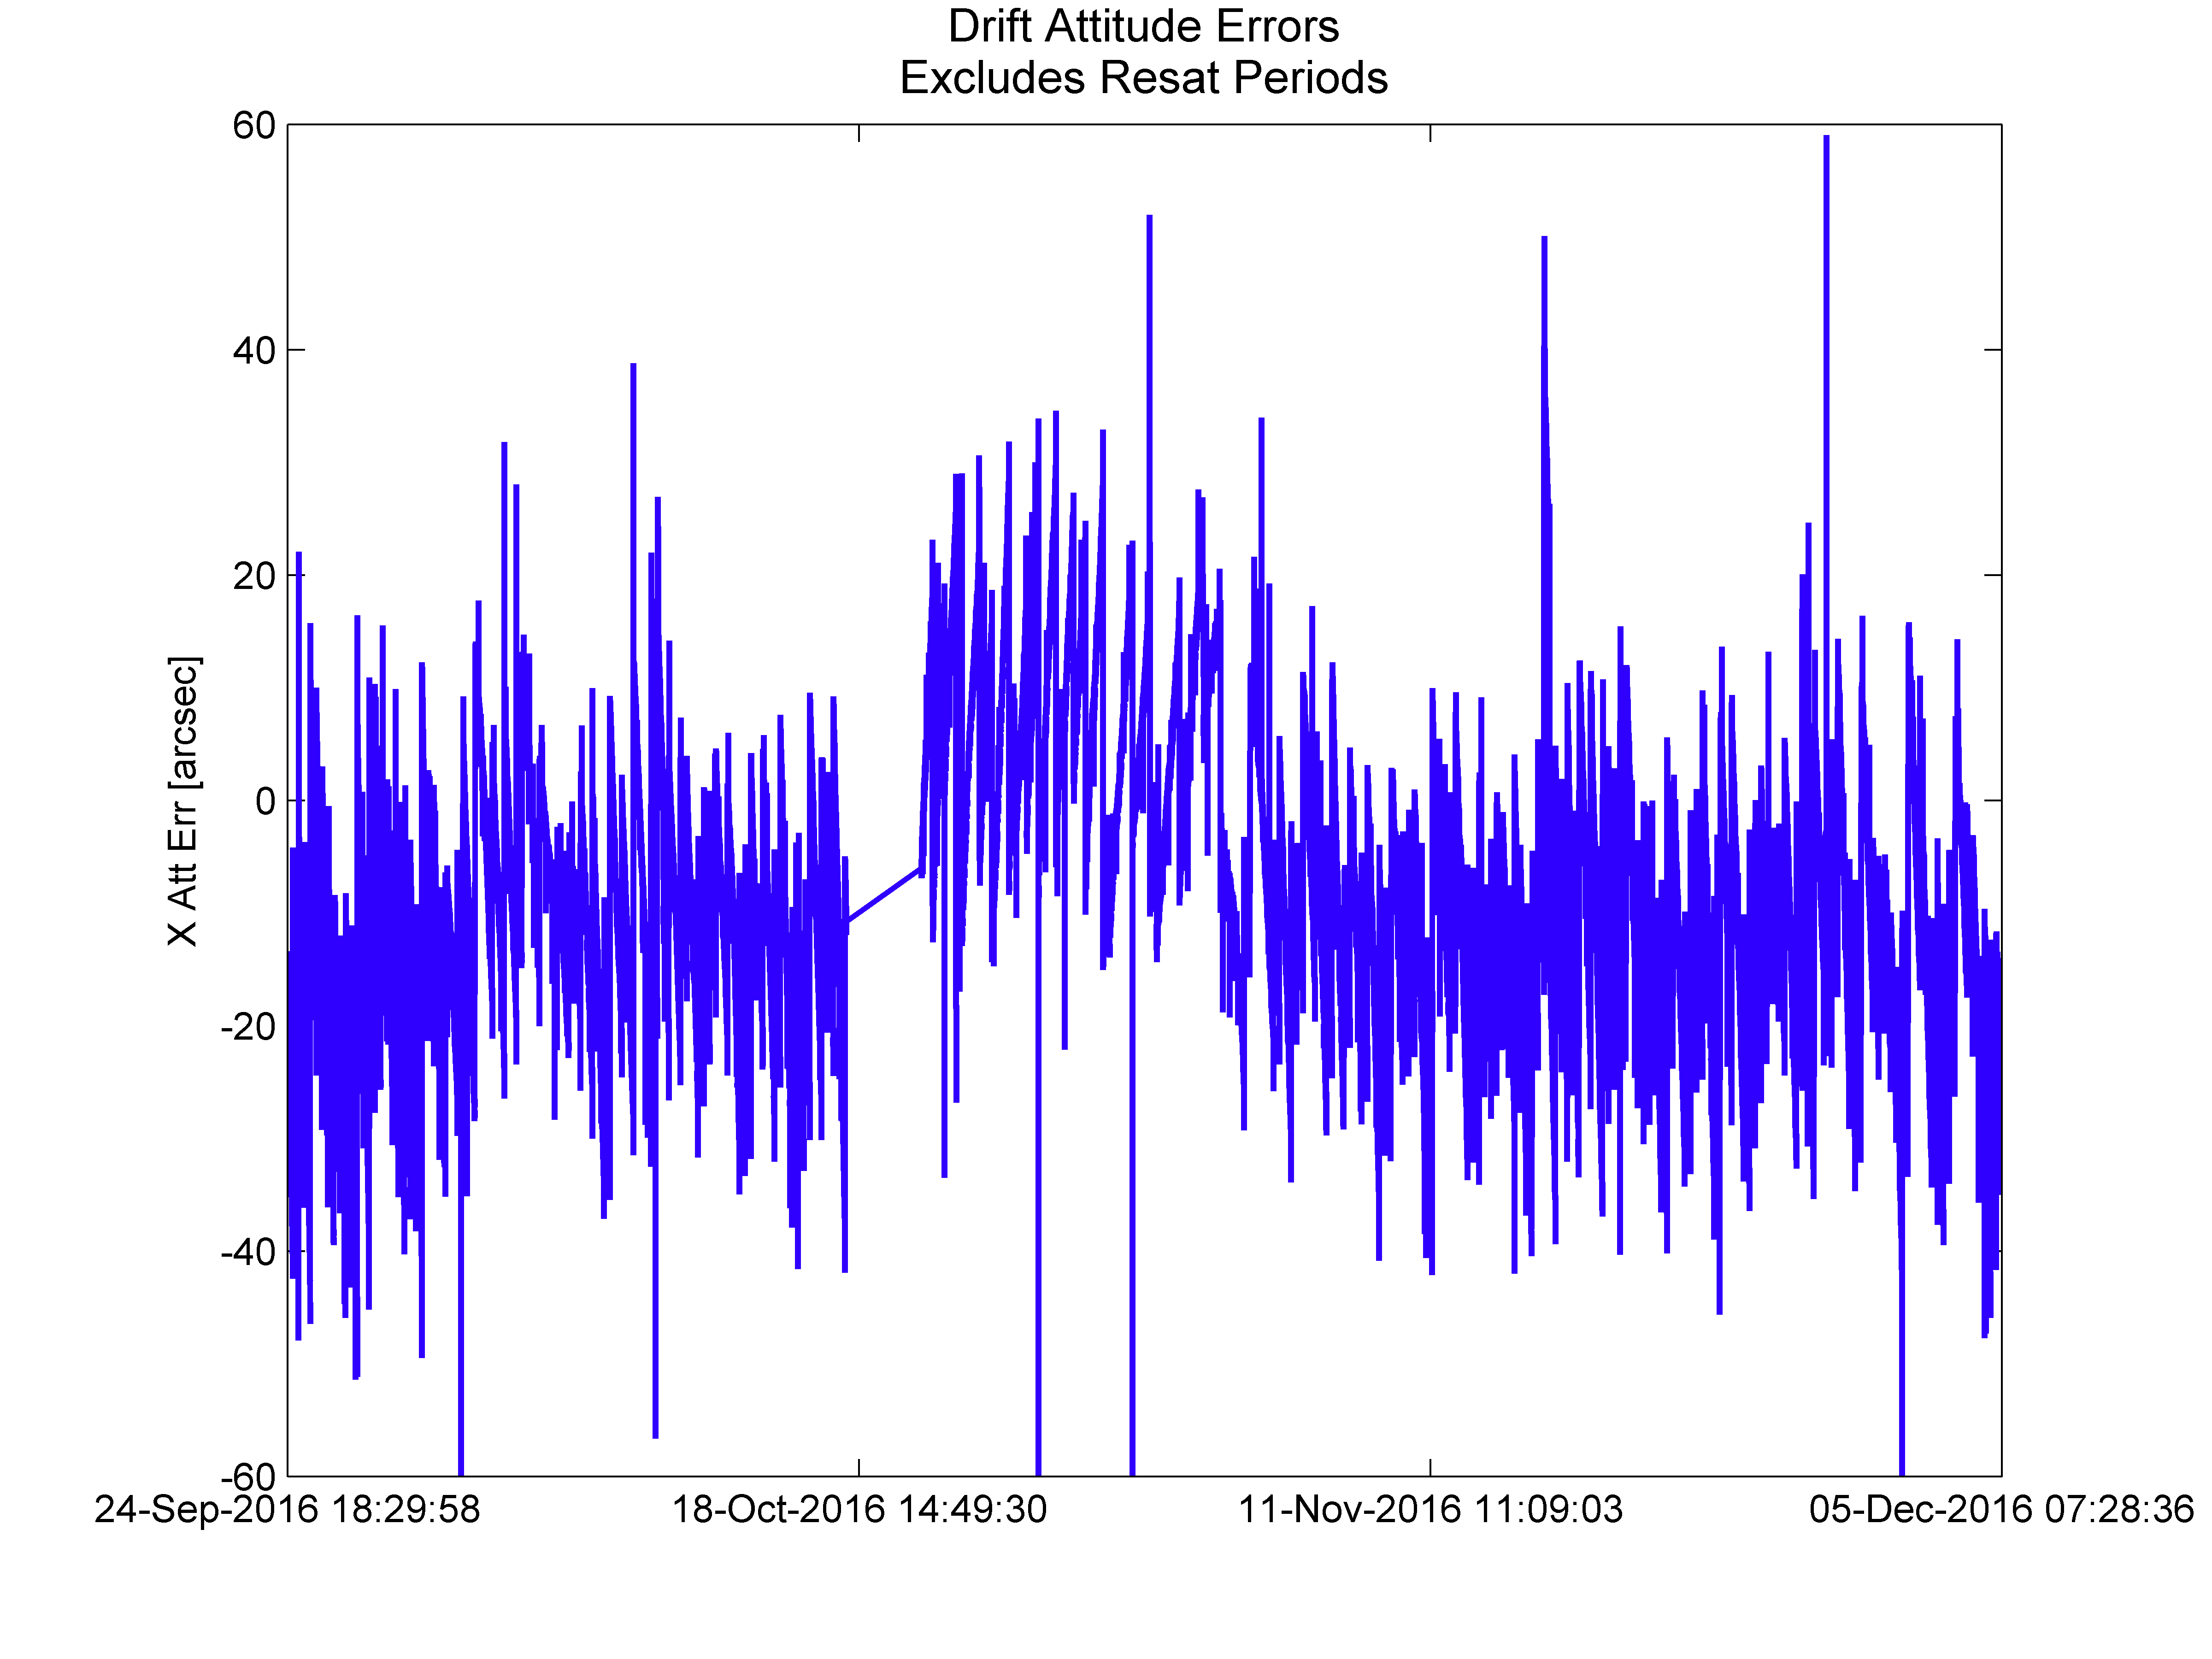
The C11a attitude error started at a relatively high value and large roll amplitude,
due in part to the initial roll offset error. The negative going roll offsets
along with the large negative roll rate at the start of C11a indicated that,
without correction, the roll would have been unacceptably large in the 6-hours
between thruster firing windows by the end of the campaign. The large roll would have
caused targets at the edge of the focal plane to roll out of their apertures.
The roll offset was corrected during the gap starting
around 2016-10-16 seen in the C11-Pointing History figure, resulting in a roll profile
for C11b that is more typical of past campaigns.
Similarly, the C11a maximum attitude residual was
somewhat high -though well within the aperture limits- while the C11b
starting maximum attitude
residual was more typical of K2 behavior.
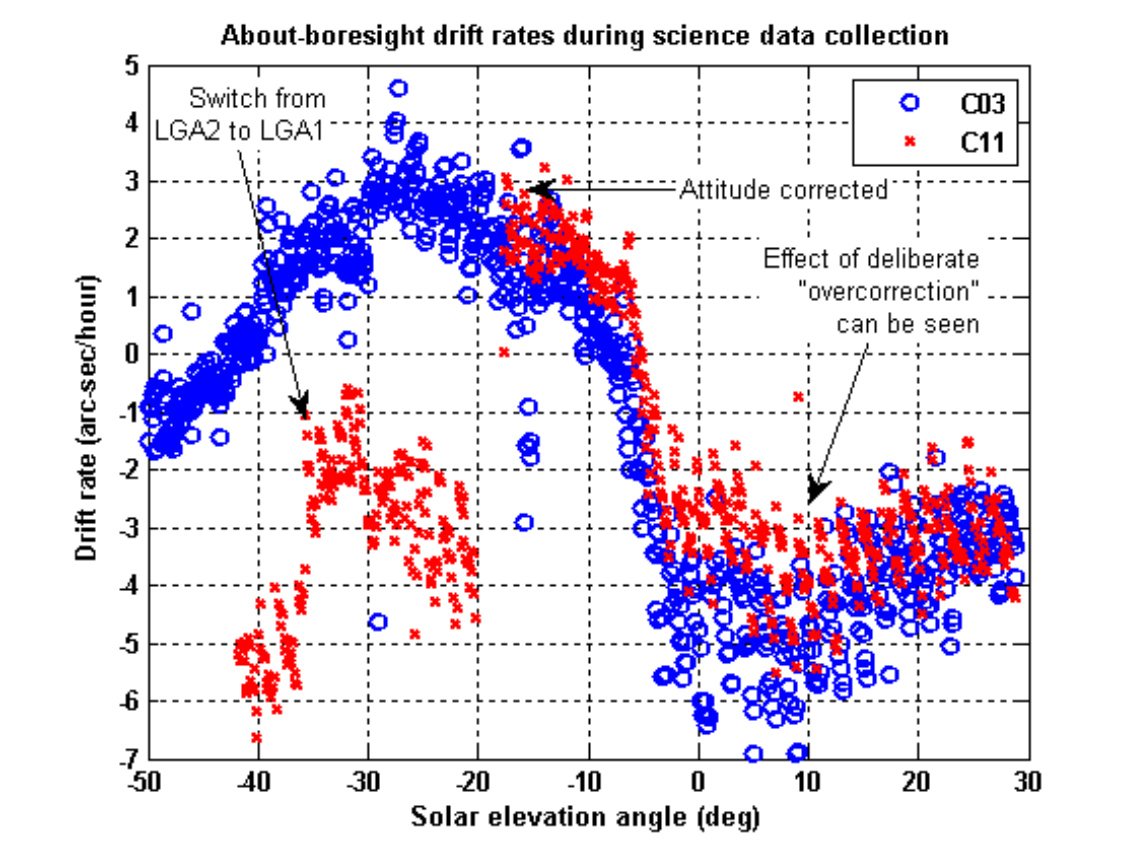
There was a smaller related change in roll behavior during C11a when the spacecraft X-band communications were switched from low gain antenna 2(LGA-2) to LGA-1. The antenna switch resulted in different thermal torque on the spacecraft and somewhat mitigated the initial C11a roll pointing error. The improvement is most evident in the roll rate at a solar elongation angle of -35º (top right panel below), but can be seen in the roll error at around 2016-10-02 (top left panel below).


Data Quality and Processing Notes
Light Curve Quality
We consider the C11a and C11b pipeline-generated light curves separately for noise analysis and comparison with previous campaigns. As in previous campaigns, the 6-hour spacecraft roll cycle continues to dominate the systematic errors in C11 simple aperture photometry light curves.
The magnitude dependence of CDPP and its distribution over the focal plane
are shown below. Other CDPP benchmarks can be found in the
table giving C11a 6.5-hr CDPP as a function of magnitude and
the C11b 6.5-hr CDPP table.
The stellar properties
for each target, available from the
EPIC catalog,
were used to distinguish dwarf and giant stars. The C11
CDPP values are in family with C7, the next most crowded K2 FOV for which
pipeline light curves were generated.


Targets Missing from the Archive
Pipeline errors during the process of exporting the light curve (LCV) and
target pixel (TP) FITS files resulted in targets from both C11a and C11b
having no LCV or TP files at the archive.
There are 194
missing targets for C11a (15 are non-custom targets) and
3
missing custom-aperture targets for C11b. There is no overlap between the C11a
and C11b missing target lists. The project is investigating options
for delivering these targets in the future.
Poor Smear Correction - Bright Stars
There were several very bright stars observed in C11 with saturation spilling over all rows of the array on three channels, corrupting the smear measurement for the affected columns. For these columns the virtual smear measurement is used for smear correction, though it is known that this value is invalid and will corrupt data on the affected columns. Given the normal motion of the stars in K2 due to roll and differential velocity aberration, it is likely that adjacent columns will be corrupted at some times during the campaign. The smear corruption is complicated in C11 due to the roll offset: stars at the edge of the array moved up to 30 pixels from C11a to C11b, while stars in the center modules moved only slightly. The channels and affected columns in C11a and C11b are given below.
| Channel | C11a columns | C11b columns |
|---|---|---|
| 35 | 888-892 | 858-861 |
| 43 | 162-165 | 160-162 |
| 58 | 167-169 | 154-158 |
LDE Flags
During the last three days of C11b we experienced a large number of parity errors coming from the photometer's local detector electronics (LDE). These LDE parity errors can occur when a very bright object saturates and spills charge into the CCD serial readout register, causing an overflow at the input to the analog-to-digital converter. The LDE parity errors were likely caused by the image of Saturn on the focal plane. These errors do not affect the quality of data from pixels on the active focal plane.
The LDE parity error triggers a flag (bit 15, decimal=16384) in the QUALITY column of the target pixel files. Most of the cadences from long cadence number 136276 (2016-12-4 00:58 UTC) to LC 136426 (2016-12-7 02:32 UTC) have the parity error flag set.
K2 Campaign 10 (Archived)
At a glance
Campaign 10 was operationally separated into two segments as a result of a 3.5-pixel initial pointing error at the start of the campaign. The offset was corrected six days into the campaign. The two segments are identified in the archive products as C101 and C102, respectively.
C10 Pointing- RA: 186.7794430 degrees
- Dec: -4.0271572 degrees
- Roll: 157.6280500 degrees
- delta-RA: 12.12951918 arcsec
- delta-Dec: -4.12973550 arcsec
- delta-Roll: -8.00606815 arcsec
- 41,531 EPIC IDs in long cadence (LC).
- 138 EPIC IDs in short cadence (LC).
- Custom targets include 16 Solar System moving objects tiled with multiple apertures, 8 bright stars covered with disk apertures to capture the PSF wings, and 27 large galaxies. See the csv file that maps the Solar system object custom aperture numbers to the target names.
Both C10 FFIs were taken at the C10b pointing. The first includes data from module~4, the second does not.
C10a First cadence- Time: 2016-07-06 19:45:29 UTC
- Long Cadence Number: 128925
- Short Cadence Number: 3856210
- Time: 2016-07-13 01:19:55 UTC
- Long Cadence Number: 129230
- Short Cadence Number: 3865389
- Time: 2016-07-13 01:49:21 UTC
- Long Cadence Number: 129231
- Short Cadence Number: 3865390
- Time: 2016-07-20 06:26:44 UTC
- Long Cadence Number: 129583
- Short Cadence Number: 3875979
- Time: 2016-08-03 06:51:51 UTC
- Long Cadence Number: 130269
- Short Cadence Number: 3896530
- Time: 2016-09-20 04:52:03 UTC
- Long Cadence Number: 132614
- Short Cadence Number: 3966909
Features and Events
Galaxies
With its high Galactic latitude, Campaign 10 observed 4,977 galaxies, over 2,000 more than in C8. Twenty-seven large galaxies were each covered using 1,500 pixel custom masks. The extragalactic targets include the well-known quasar 3C 273 (EPIC 229151988).
Comet 67P: Churyumov-Gerasimenko
Comet 67P was observed in C10b from September 7 through September 20 as it crossed channels 69 and 70. The comet was observed using 2200 custom aperture tiles.
Segmenting of C10 Data
The C10 data were processed through the pipeline in two separate sets:
- The first six days of data, dubbed C10a, were collected with a pointing error of 3.5 pixels from the nominal field-of-view, so they were only processed through CAL to make Type 1 target pixel files and collateral data files.
- The remainder of the campaign, dubbed C10b, was processed through the entire photometry pipeline, creating Type 2 target pixel files, long-cadence light curves, and collateral data files.
Attitude Offset in C10a
C10a data collection started with a pointing error from the intended C10 attitude of 3.5 pixels. This pointing offset potentially invalidates many of the target pixel apertures. The apertures for data collection include the pixels needed for photometry plus additional halos to allow for pointing errors or target catalog errors. Two halos are used in the center of the array and three halos are used in the outer portions to account for the increased roll-induced motion of targets further from the center of the array. Since the C10a initial pointing error was 3.5 pixels, it is likely that significant flux from target stars fell outside their aperture during the K2 roll cycle. Users should check the validity of the aperture for their particular target in C10a before interpreting the flux measurements.
The spacecraft attitude was adjusted at 2016-07-13 01:49:21 UTC to correct the pointing error, marking the start of C10b.
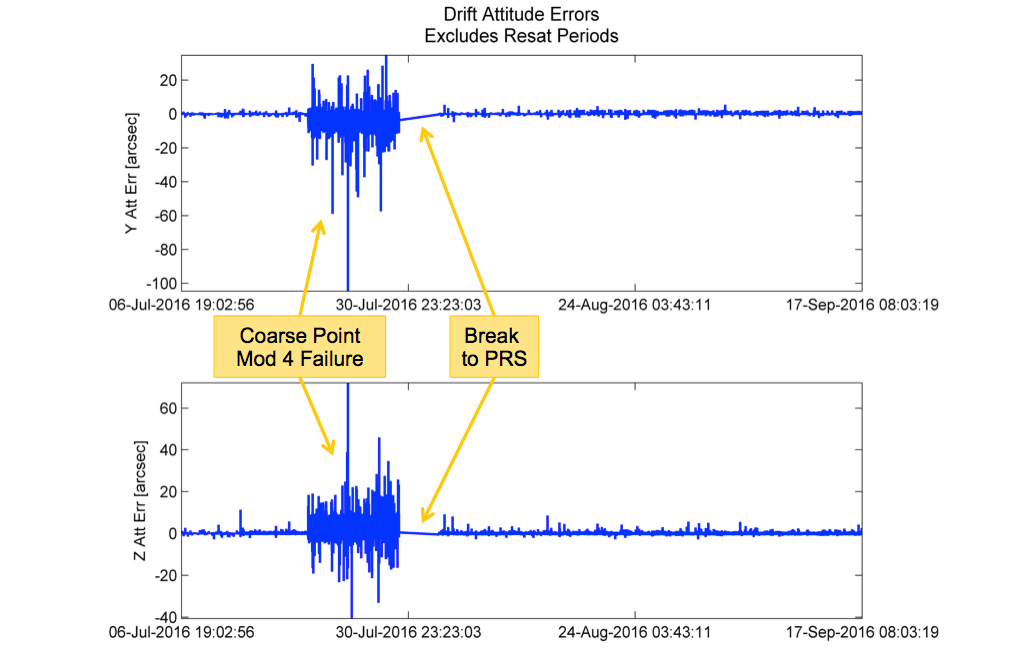
Loss of Module 4
An additional complication arises in the C10b data due to the loss of module 4 seven days into C10b (around 2017-07-20 07:00 UT), which powered off the photometer resulting in a 14-day data gap. The cause of the module 4 failure is not known, but the sequence of telemetry faults leading up to the failure and the post-recovery behavior of the focal plane are similar to those seen around the failures of module 7 (January 2014) and module 3 (January 2010). These failures were attributed to a blown fuse in the focal plane local detector electronics (LDE) driver boards, likely due to the failure of an upstream component creating an over-current load.
The C10b spacecraft pointing on either side of this data gap was consistent and at the correct C10 attitude, so flux values should be consistent across the gap. Note that PDC corrected fluxes may show inconsistent systematic error corrections across the 14-day gap, as the cotrending basis vectors can be dominated by systematics present on one side of the gap but not the other side.
Pointing and Roll Performance
Apart from the initial pointing error in C10a, the C10a and C10b pointing and roll behavior were typical of K2 campaigns. The cross-boresight pointing was well behaved outside of the coarse point portion caused by the failure of module 4 (see Figure C10-Pointing History). However, the photometer was off during this time, so no coarse-point science data were collected. The roll behavior during C10 was also nominal. The pipeline calculated maximum distance between the derived and nominal positions for any target (the "maximum attitude residual", or MAR) for C10b was well under the 3-pixel limit accommodated by the aperture halos.

Data Quality and Processing Notes
Calibrated Target Pixel Files
This data release consists of calibrated target pixel files (TPFs) and supporting calibration files for C10a, as well as a full set of archive files (TPFs, calibration files, and light curve files) for C10b. The two separate sets of calibrated TPFs for C10a and C10b have filenames that contain "C101" and "C102" respectively.
Because the full pipeline was not run, the C10a TPFs are Type-1 files. The C10b TPFs are Type-2 and contain all the nominal calibration information. See Type-1 vs Type-2 TPFs for details on the contents of the Type-1 versus Type-2 files.
Since the thruster firing flags are not populated in FITS quality flags for the C10a Type-1 TPFs, they are delivered as separate long-cadence (thruster_firing_flags_C10_lc.csv) and short-cadence (thruster_firing_flags_C10_sc.csv) thruster firing tables for the combined C10a + C10b campaign. Thruster firing flags are populated in the FITS quality flag in the C10b Type-2 TPFs.
Light Curve Quality
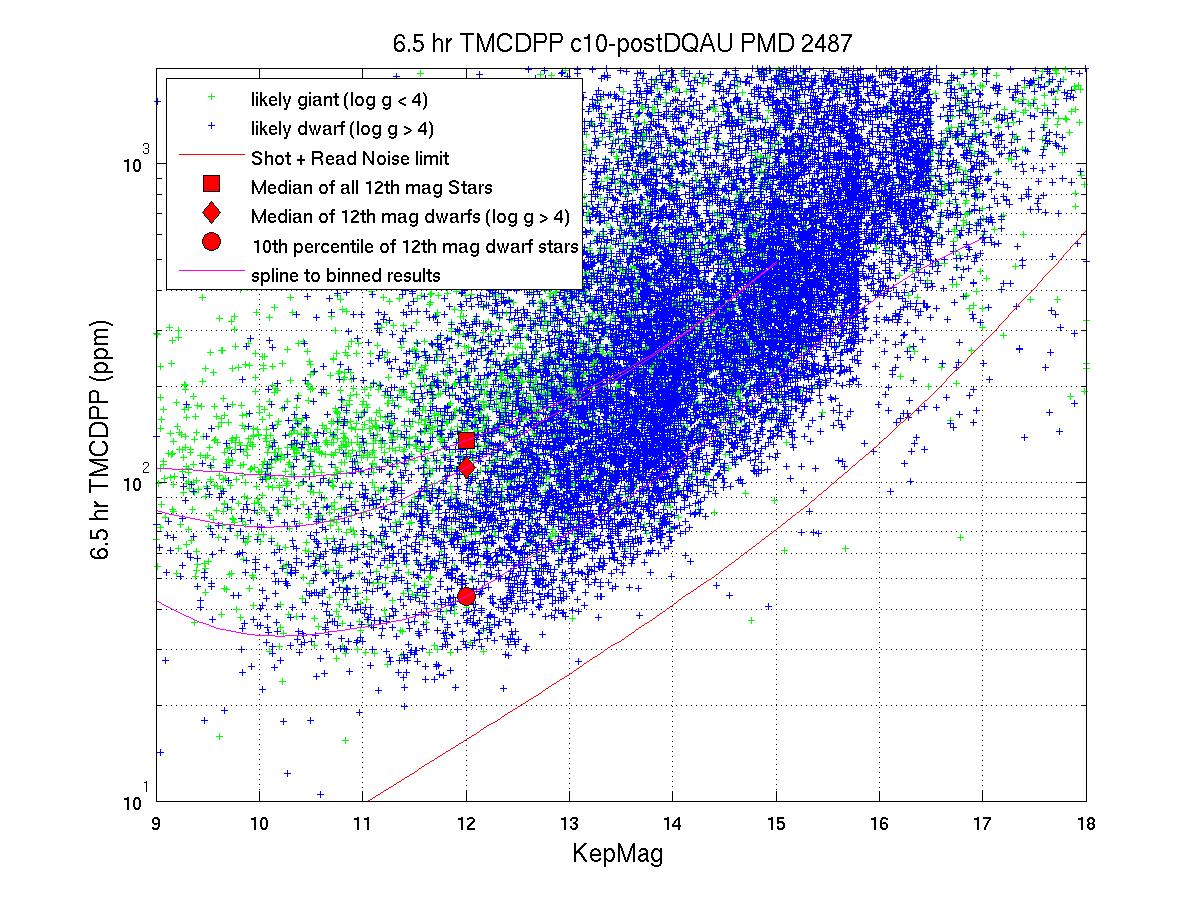
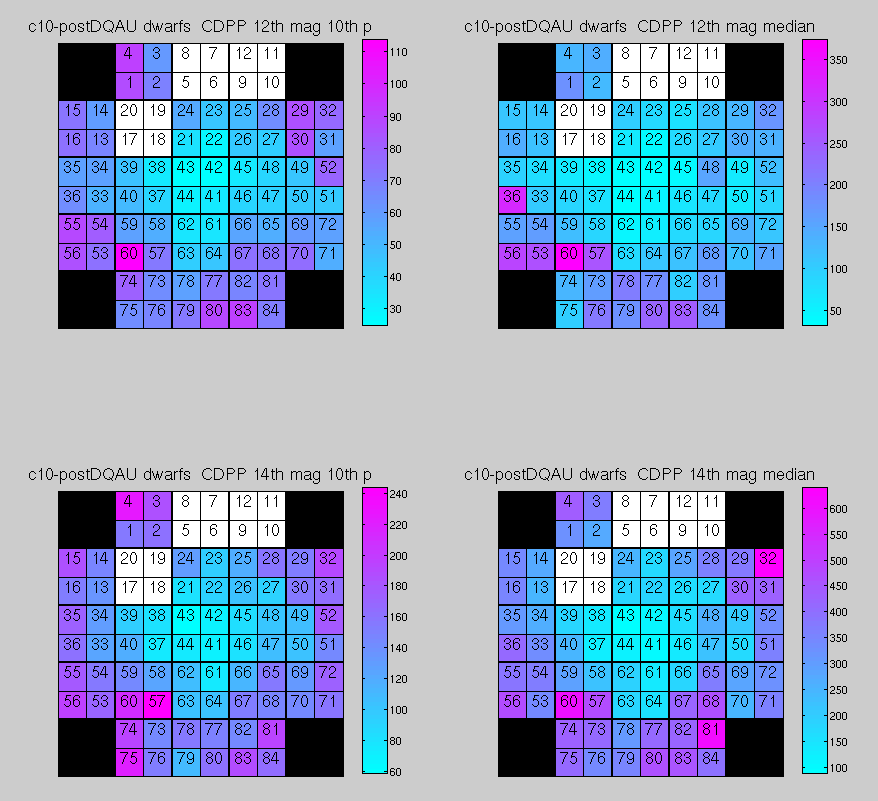
We consider only the C10b pipeline-generated light curves for noise analysis and comparison with previous campaigns. As in previous campaigns, the 6-hour spacecraft roll cycle continues to dominate the systematic errors in C10 simple aperture photometry light curves.
The magnitude dependence of CDPP and its distribution over the focal plane
are shown below. Other CDPP benchmarks can be found in the
table giving 6.5-hr CDPP as a function of magnitude. The stellar properties
for each target, available from the
EPIC catalog,
were used to distinguish dwarf and giant stars. The C10b
CDPP values compare favorably with those from C8 and other nominal K2 campaigns.
Poor Smear Correction - Bright Stars
There are two channels in C10 containing very bright stars with saturation spilling over all rows of the array, corrupting the smear measurement. On channel 28 (mod.out 9.4) saturated charge from HD 110380 (V=3.5) spills across all rows of columns 829 & 830 in C10a and 831 & 832 in C10b. On channel 65 (19.1) saturated charge from HD 107259 (V=3.9) spills across all rows of columns 961 & 962 in C10a and 962 & 963 in C10b. In both cases, the virtual smear measurement is used for smear correction, though it is known that this value is invalid and will corrupt data on these columns. Given the normal motion of the stars in K2 due to roll and differential velocity aberration, it is likely that adjacent columns will be corrupted at some times during the campaign.
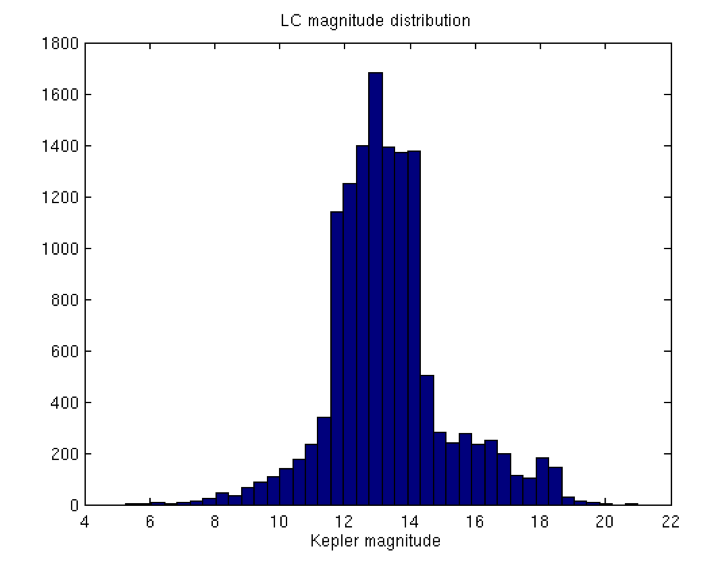
K2 Campaign 8 (Archived)
At a glance
- RA: 16.3379975 degrees
- Dec: 5.2623459 degrees
- Roll: -157.3538761 degrees
- 29,939 EPIC IDs in long cadence (LC).
- 63 EPIC IDs in short cadence (LC).
- 26 unique LC custom targets were selected. See the csv file that maps the custom aperture number to the target name.
- Time: 2016-01-04 13:16:25 UTC
- Long Cadence Number:119907
- Short Cadence Number: 3585670
- Time: 2016-03-23 06:48:35 UTC
- Long Cadence Number: 123759
- Short Cadence Number: 3701259

Features and Events
Uranus
Uranus and four of its moons were observed with custom masks during Campaign 8. The path of Uranus was tiled with 245 single column target definitions at long cadence and with nine 9 x 307 trapezoidal masks at short cadence. The moons Caliban, Prospero, Setebos, and Sycorax were observed with separate custom masks. Uranus is the brightest moving object yet observed by K2.
Galaxies
With its high Galactic latitude, Campaign 8 was ideal for observing galaxies. There were 2750 galaxies targeted, including IC 1613 (Caldwell 51), an irregular dwarf galaxy in the Local Group. IC 1613 was tiled with 48 20 x 20 pixel masks for a total of 19,200 pixels.
Roll Drift Returns to Normal
Based on the C7 degraded roll performance, the Mission Operations Center switched back to low-gain antenna LGA1 for spacecraft communication during most of C8. The switch resulted in a return to nominal K2 roll performance and drift rates. The campaign was started using LGA2, as was used in C7, and then starting around 23 Jan 2016 23:50 UTC operations were switched to LGA1. The antenna swap can be seen in the roll drift attitude error.
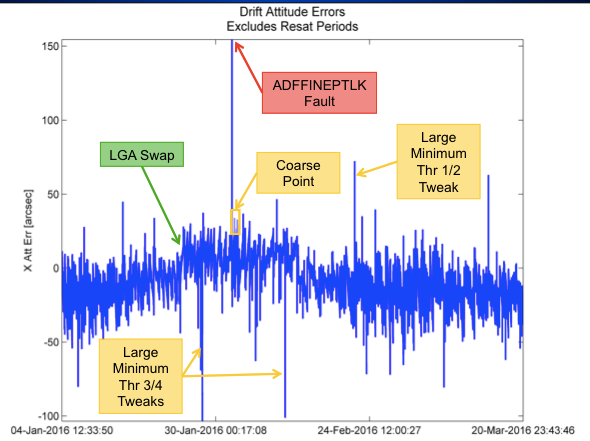
Loss of Fine Point On 2016-02-01 16:40 UTC the spacecraft dropped out of fine point control. Observations continued in coarse point, with much degraded pointing performance, until 2016-02-02 22:27:26 UTC when the spacecraft reacquired fine point during a resat period. This resulted in 29:47:53 of coarse point data collection. These cadences are flagged as "spacecraft is not in fine point" using bit 16 in the data quality flags. The loss of fine point occured following a thruster firing fine tweak that resulted in the spacecraft rolling in the wrong direction. The next tweak was unable to correct the attitude before the loss of fine point fault was triggered, but fine pointing control was restored automatically at the next momentum wheel resaturation. There were several other instances of anomalous thruster firing tweaks in C8, none of which resulted in loss of fine point. Their cause is under investigation.
Data Quality and Processing Notes
Light Curve Quality
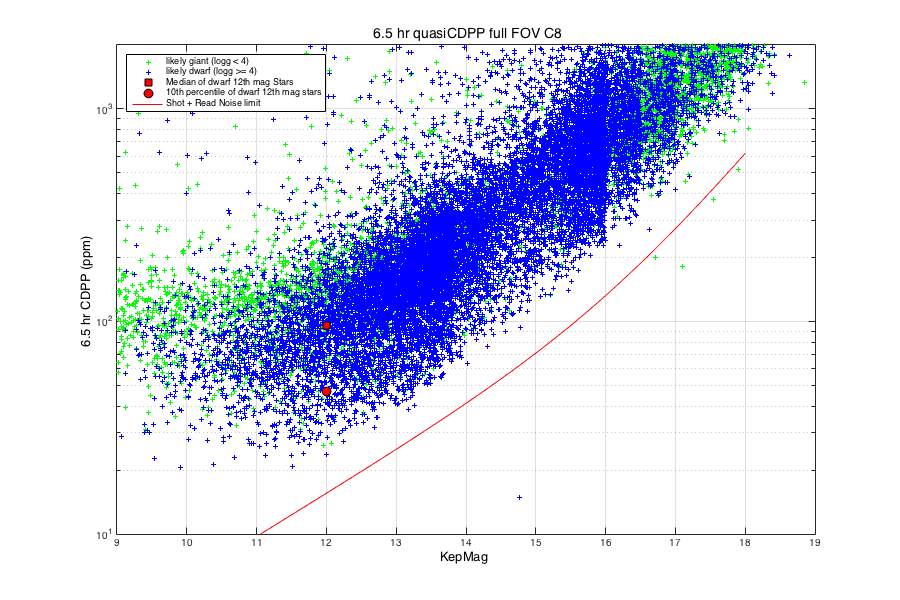
The dominant systematic present in K2 simple aperture photometry light curves is a sawtooth shape that is due to the roll of the spacecraft, which is corrected approximately every 6 hours. With the return to more nominal K2 roll performance in C8, we find CDPP values have improved noticeably over those from C7. Below, we examine observed noise levels in the PDC light curves for C8, Data Release 11.
Analysis of the light curve quality reveals that CDPP values are decreased by roughly 20% from C7, from 59.2 ppm in C7 to 47.0 ppm in C8, as measured by the tenth percentile of 12th magnitude dwarfs. The values are comparable to those from C4-C6.
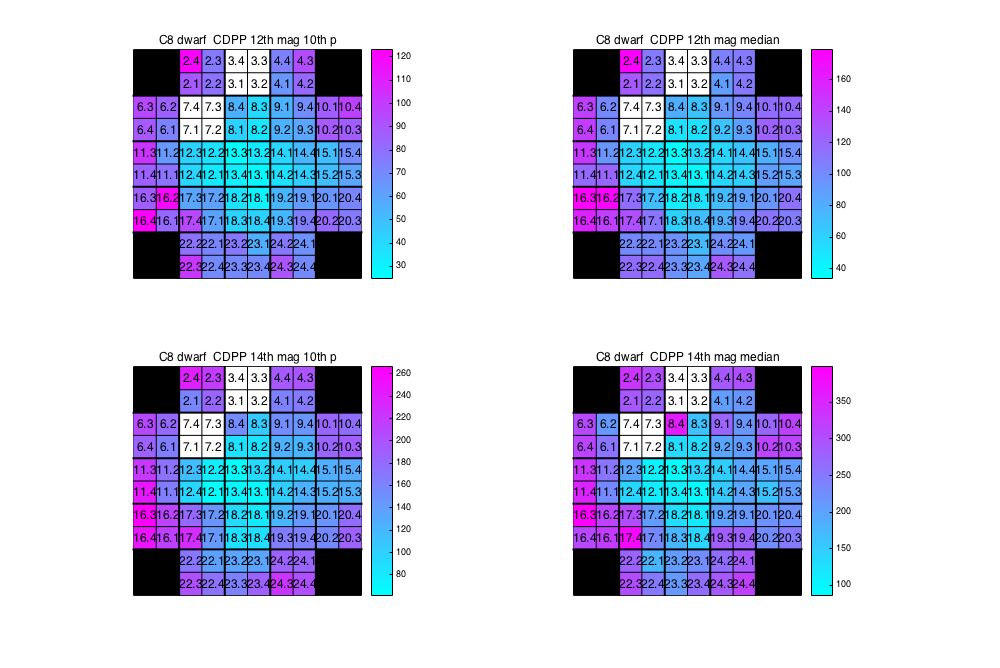
The magnitude dependence of CDPP and its distribution over the focal plane are shown below. Other CDPP benchmarks can be found in the table giving 6.5-hr CDPP as a function of magnitude.
Poor Smear Correction
Bright Stars
There are 2 channels in C8 for which the saturation spill due to very bright stars corrupts both the masked and virtual smear measurements for one or more columns. The affected channels are 23 (columns 500-507 and 1055-1059) and channel 45 (columns 162-166). In these cases, in order to allow the pipeline calibration to complete, we flag the masked smear as bad and process the data with only the virtual smear. As a result, the smear correction will be poor for the channel/column combinations listed above and will be suspect for the same columns on other outputs of the same module due to video crosstalk.
We identified 5 individual targets whose light curves are clearly affected by the poor smear correction: EPIC-220519545 and 220549392 (ch 23); EPIC-220530070 and 220539101 (ch 45), and EPIC-220566642 (ch 48). During this smear investigation, we identified one additional target, EPIC-220498268 on channel 65, that is within the saturation spill of a very bright star and has a similarly corrupted light curve.
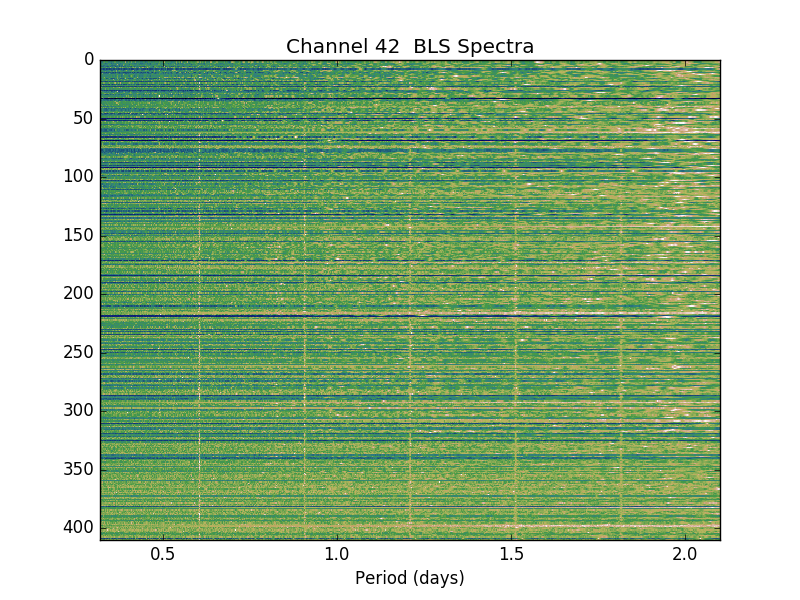
Intermittent Streaks
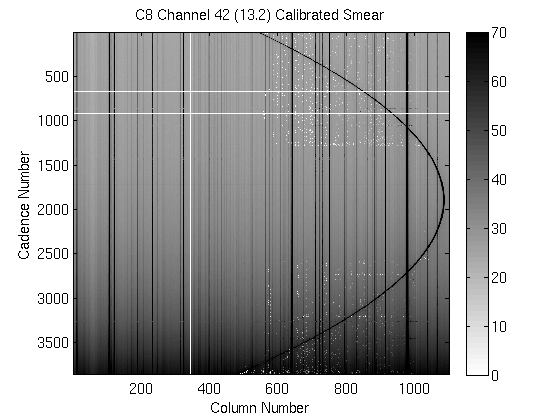
There are episodic smear correction errors on channel 42 (mod.out 13.2), the channel containing the Uranus supermask. Nearly every long cadence in the supermask appears to contain between 2 and 20 columns which are brightened by 10 to 80 counts. The brightening of a column lasts only for a single cadence, with no obvious patterns as to which columns are affected in a given cadence. Two example cadences which are particularly affected are 119980 and 119982.
Preliminary investigation indicates that this streaking is caused by false cosmic ray detections in the smear collateral data. Because we do not see similar streaking in the supermask for IC 1613, located on channel 58, we believe that the poor cosmic ray detector performance is due to the bright signal from Uranus moving across columns and altering the cosmic ray detector's dynamic threshold. When false cosmic rays are removed from the smear signal, the pixel data in that column is under-corrected, resulting in a brightening of that column for a given cadence. The streaks are not in the raw data, so users may wish to do their own smear correction on this channel.
The extent of the problem in time and CCD columns can be seen in the figure C8-Channel 42 Calibrated Smear. The long cadence data were calibrated in three segments of ~1284 cadences each. The false cosmic ray detections are present in columns where Uranus appeared at any time during the set of cadences being processed. In the figure, the false detections are seen to be confined primarily to the first segment (relative cadence 1-1285, LC number 119907-121191) and third segment (relative cadence 2570-3853, LC number 122476-123759) and to columns above 500. Targets on channel 42 below column 500 should be relatively unaffected by this anomaly.
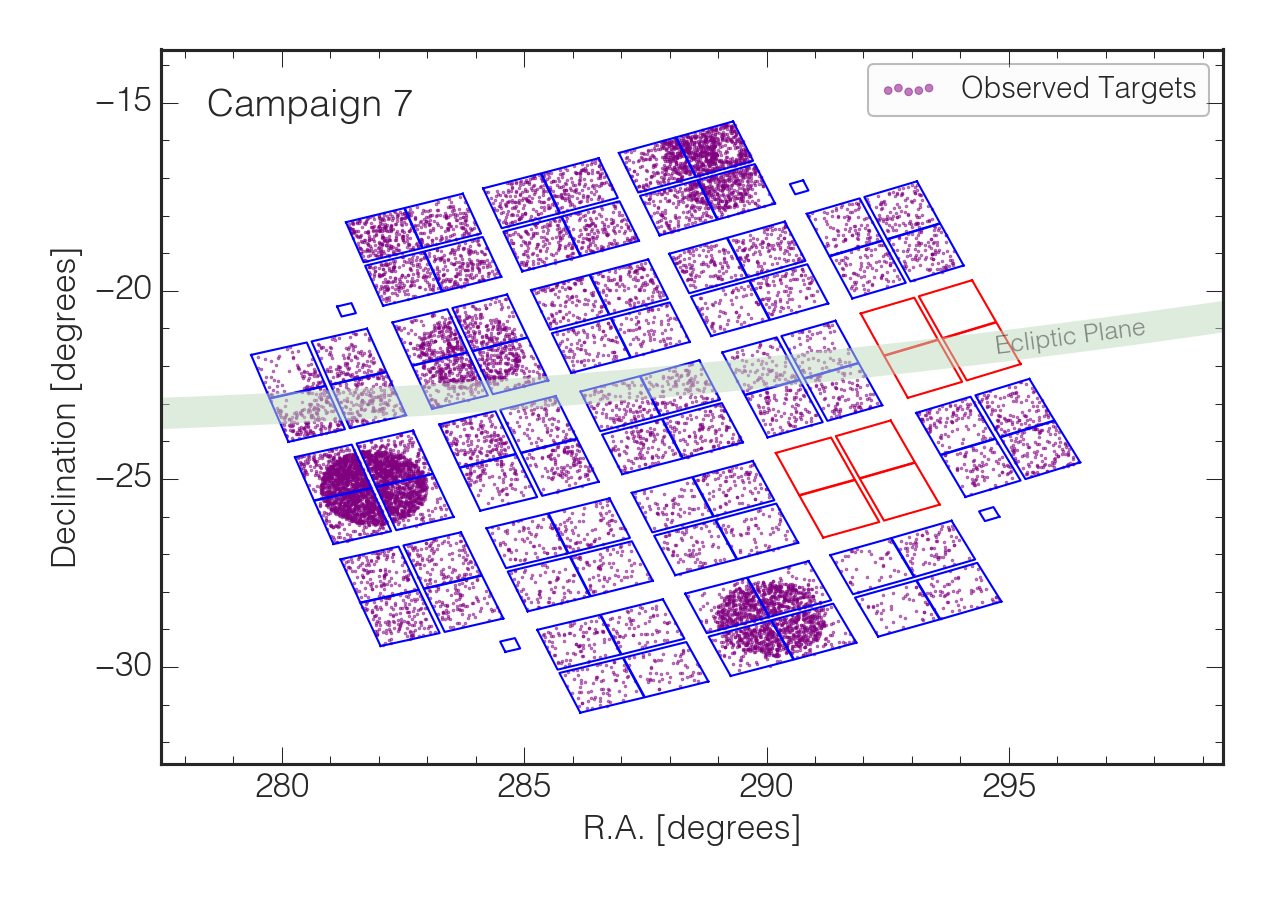
K2 Campaign 7 (Archived)
At a glance
- RA: 287.82850661 degrees
- Dec: -23.36001815 degrees
- Roll: -172.78037532 degrees
- 15,085 EPIC IDs in long cadence (LC).
- 72 EPIC IDs in short cadence (LC).
- Several custom targets were selected. See the csv file that maps the custom aperture number to the target name.
- Time: 2015-10-04 17:52:39 UTC
- Long Cadence Number:115414
- Short Cadence Number: 3450880
- Time: 2015-12-26 08:35:28
- Long Cadence Number: 119456
- Short Cadence Number: 3572169
Features and Events
Pluto
Pluto, one of the largest trans-Neptunian objects, previously known as the ninth planet in our solar system, was observed during Campaign 7. The path of Pluto was tiled with 1 x n pixel target definitions, where n ranges from 1 to 217. The range of custom aperture numbers for Pluto is 200062954 -- 200062827. The animated gif below shows Pluto as observed by K2.
Ruprecht 47
Ruprecht 47 is an open cluster observed with K2 during Campaign 7. It was observed using a super-aperture, tiled with 60 51 x 51 masks, totalling 156,060 pixels. The custom aperture numbers range from 200062524 -- 200062583.
Increase in Roll Drift
For C7, an alternate low-gain antenna was active during science data collection. The previously used LGA1 was replaced by LGA2 (see KIH Figure 2), as the latter is slightly better oriented with respect to earth. (This partially compensates for the increasing distance to the spacecraft in its earth-trailing orbit, now at 0.8 AU.) Since the two antennas are mounted on opposite sides of the spacecraft, this antenna swap produced a change in radiation pressure that placed an additional (unbalanced) torque about the boresight on the spacecraft. The resulting increase in roll drift is illustrated in Figure C7-RollDrift, which compares the drift rates for C4, C6, and C7. Consequently, the maximum excursion of any pixel from its nominal position is significantly larger for C7 than for previous campaigns (see Figure C7-MAR).
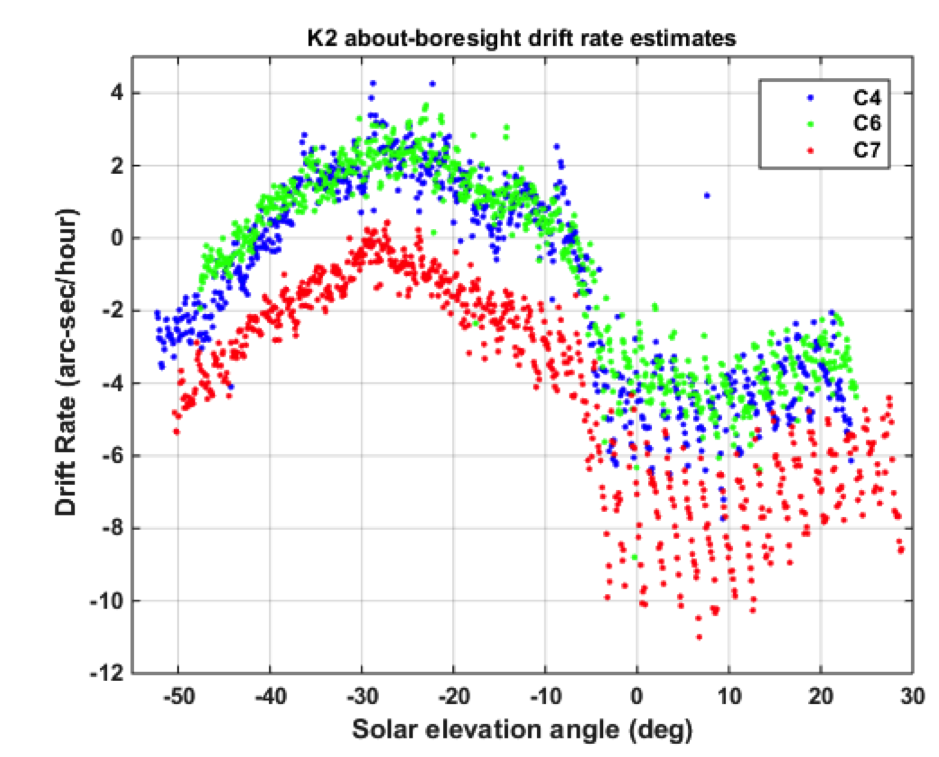

Given this unanticipated result, LGA1 will be used for C8, C9, and C10, while the fields of view for C11, C12, and C13 were tweaked by 0.12° – 0.16° (see GO blog) so that a subsequent return to LGA2 should have no adverse effects on data quality.
Effect of Roll on Photometry
The unusually large roll motion in C7, combined with an extremely crowded field, had a strong impact on photometry, particularly on targets near the edge of the focal plane. This impact has several components:
- In some cases target stars came close to the edge of their aperture masks. In such cases the photometric precision will be low.
- Background estimates based on background polynomials were strongly polluted by stars rolling in and out of the background apertures. This is especially true for channels near the edge of the focal plane (more roll) and near the Galactic plane (more stars). As a result, the background is strongly over-corrected, with short-time background variations strongly correlated with roll motion. These background variations have been subtracted from all pixels on the channel.
- The peaks of the roll motion in the background pixels were often incorrectly identified as cosmic rays and removed. The resulting change in background is minor in magnitude, but potentially diminishes the correlation between background variations and roll motion.
The motion polynomials generally did a reasonable job tracking the large roll motion, and this enabled the computation of photometric apertures that significantly reduced the impact of roll motion in many cases. In other cases, however, the roll motion was too large for the recovery of high-quality photometry using the standard pipeline processing.
In addition to the issues with unusually large roll and crowding, stars selected for observation were unusually distributed in C7, with some channels having many targets and other channels having relatively few targets. The result was that some channels had few target stars in the range of magnitudes used to characterize field motion via motion polynomials. A particularly dramatic example is channel 24.4, where all the targets used to create the motion polynomial for this channel are in one corner, resulting in a very inaccurate motion polynomial. Because motion polynomials are used in the creation of the photometric aperture, photometry for some targets on 24.4 may be particularly poor.
Data Quality and Processing Notes
Light Curve Quality
The dominant systematic present in K2 simple aperture photometry light curves is a sawtooth shape that is due to the roll of the spacecraft approximately every 6 hours. The PDC module of the Kepler Pipeline uses Principle Component Analysis to remove this signal in addition to other systematics. Below, we examine observed noise levels in the PDC light curves for C7, Data Release 9.
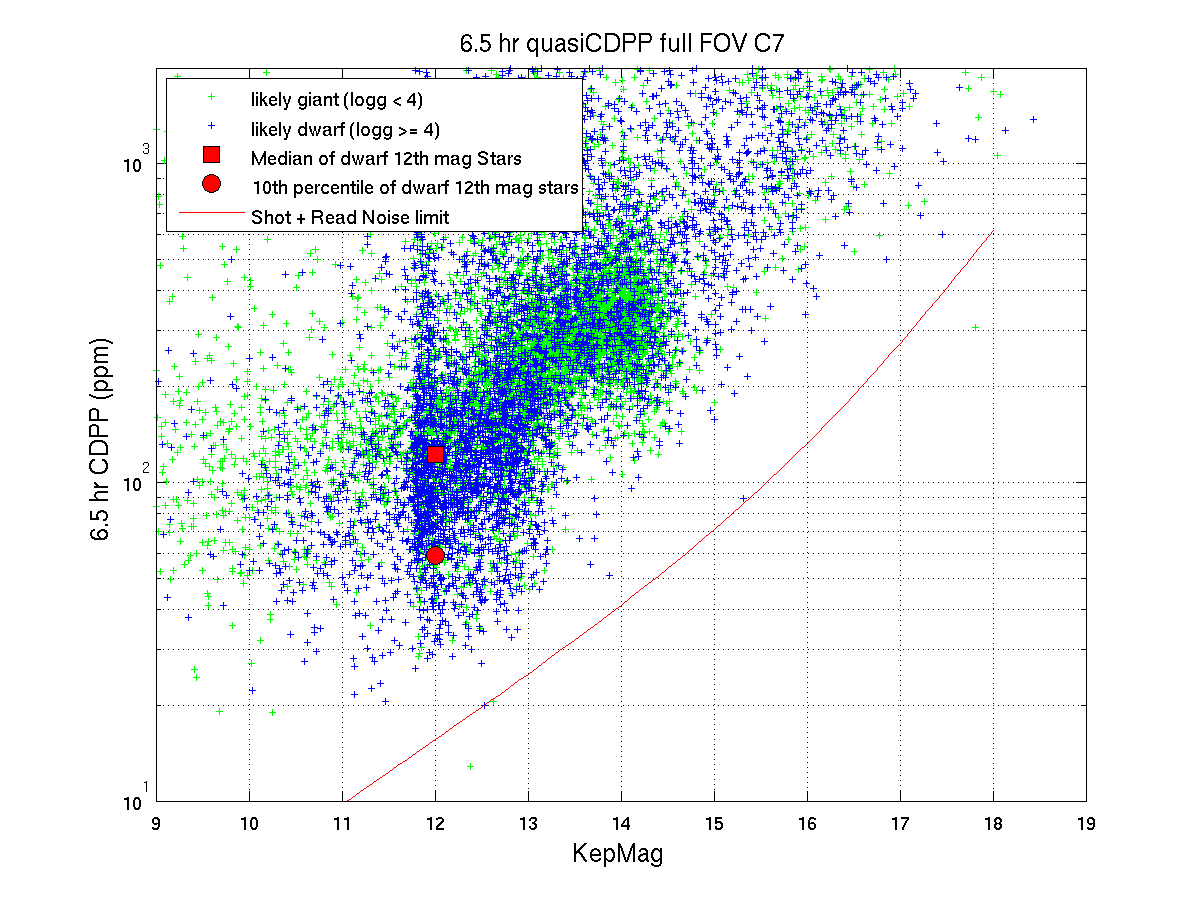
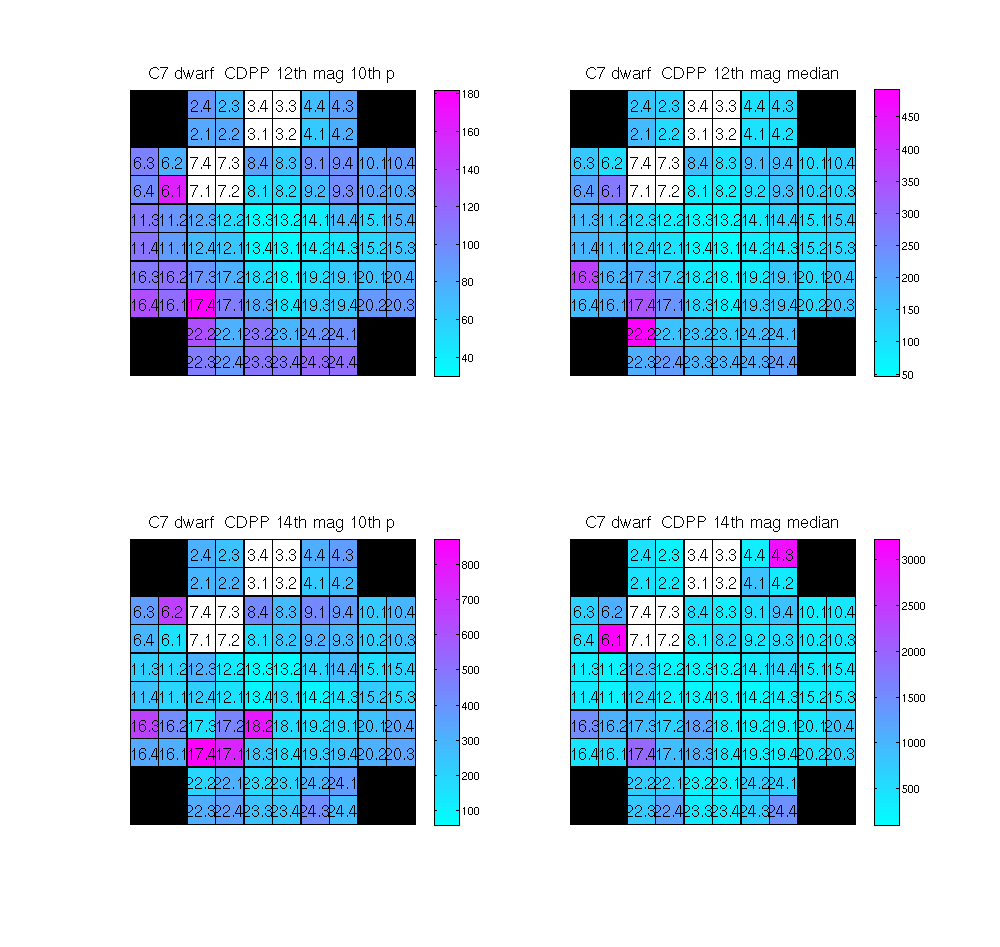
Since two halos were used for targets near the center of the focal plane and three halos were used for targets around the periphery, the requisite pixels were captured, but the increased roll motion has severely challenged the data processing pipeline’s ability to perform high-precision photometry. Analysis of the light curve quality reveals that CDPP values are increased by roughly 35% above the benchmark value (tenth percentile of 12th magnitude dwarfs) compared to C4-C6.
Table giving 6.5-hr CDPP as a function of magnitude.
Poor Smear Correction
There are 4 channels in C7 for which the saturation spill due to very bright stars spans all CCD rows for one or more columns, corrupting both the masked and virtual smear measurements for these columns. In these cases, in order to allow the pipeline calibration to complete, we flag the masked smear as bad and process the data with only the virtual smear. As a result, the smear correction will be poor for the channel/column combinations listed below and will be suspect for the same columns on other outputs on the same module as the indicated channel due to video crosstalk.
- Channel | Columns
- 45 | 685:691
- 53 | 42:51
- 65 | 819:828
- 67 | 234:242
K2 Campaign 6 (Archived)
At a glance
- RA: 204.8650344 degrees
- Dec: -11.2953585 degrees
- Roll: 159.6356000 degrees
- 47,550 EPIC IDs in long cadence (LC).
- 84 EPIC IDs in short cadence (LC).
- Several custom targets (see below)
- Time: 2015-07-13 22:45:04 UTC
- Long Cadence Number: 111362
- Short Cadence Number: 3329320
- Time: 2015-09-30 21:11:29 UTC
- Long Cadence Number: 115224
- Short Cadence Number: 3445209

Features and Events
Spica
The star Spica (α Virginis, EPIC 212573842) the 15th brightest star in the sky, is on silcon during Campaign 6. As can be seen on the FFI below, Spica is on mod.out 18.3 (channel 63) and its Schmidt-corrector reflection lies on mod.out 8.3. The star bleeds into both smear regions, preventing proper smear correction on columns 805-816 on channel 63. Also, because of cross-talk, the Spica signal appears on all channels of module 18 at the same row and column position, but to a lesser degree. For more information on cross-talk, see the Instrument Handbook.

Observed Trojans
During Campaign 6, K2 observed 65 Trojan asteroids. Each was tiled with 1 x n pixel target definitions, where n ranges from 1 to 217. The tiled regions for three examples are shown in the figure below. The range of custom aperture numbers given to the Trojans is 200041889 -- 200061149. A mapping of the minor planet designation numbers to the custom aperture numbers can be downloaded here.
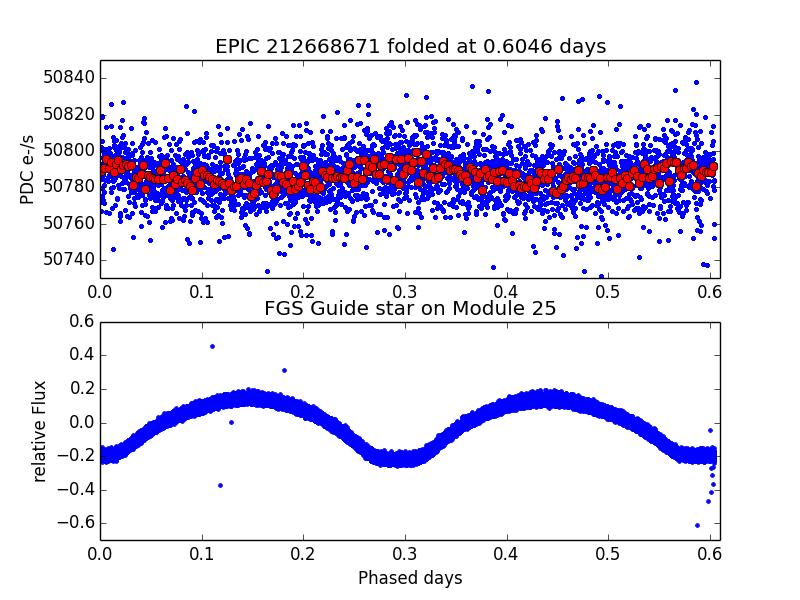
Variable Guide Star
The star on Module 25 used for guiding during C6 was highly variable. No adverse effects of this variability were detected in the data collection or spacecraft operations.
*Update -- February 18, 2016*
The signal seen in the guide star on module 25 appears to be that of a contact binary with a period of 14.5 hours and a depth of approximately 40 percent. A signal with the same period and phase is seen in a large number of long cadence, PDC, light curves with an amplitude as large as 0.1 per cent. See the folded light curve, and normalized BLS spectra below. The mechanism by which this signal is propagating into the K2 data is still under investigation.
To help users understand and mitigate the effects of this guide star, we make available the module 25 guide star fluxes in a csv file. The guide star was selected from the USNO catalog and has an RA of 200.6867 degrees, Dec of -6.0353 degrees, and R magnitude of 9.51.
*Update -- April 2016*
See this addendum for a thorough description of the pointing and photometric errors induced by the variable guide star in C6.
Data Quality and Processing Notes
Light Curve Quality
The dominant systematic present in K2 simple aperture photometry light curves is a sawtooth shape that is due to the roll of the spacecraft approximately every 6 hours. The PDC module of the Kepler Pipeline uses Principle Component Analysis to remove this signal in addition to other systematics. Below, we examine observed noise levels in the PDC light curves for C6, Data Release 8.
Table giving 6.5-hr CDPP as a function of magnitude.

K2 Campaign 5 (Archived)
At a glance
- RA: 130.1576478 degrees
- Dec: 16.8296140 degrees
- Roll: 166.0591297 degrees
- 25,850 in long cadence (LC)
- 204 in short cadence (SC)
- Several custom targets (see below)
- Time: 2015-04-27 02:18:11.949 UTC
- Long Cadence Number: 107552
- Short Cadence Number: 3215020
- Time: 2015-07-10 22:39:43.571 UTC
- Long Cadence Number: 111214
- Short Cadence Number: 3324909

Features and Events
M67
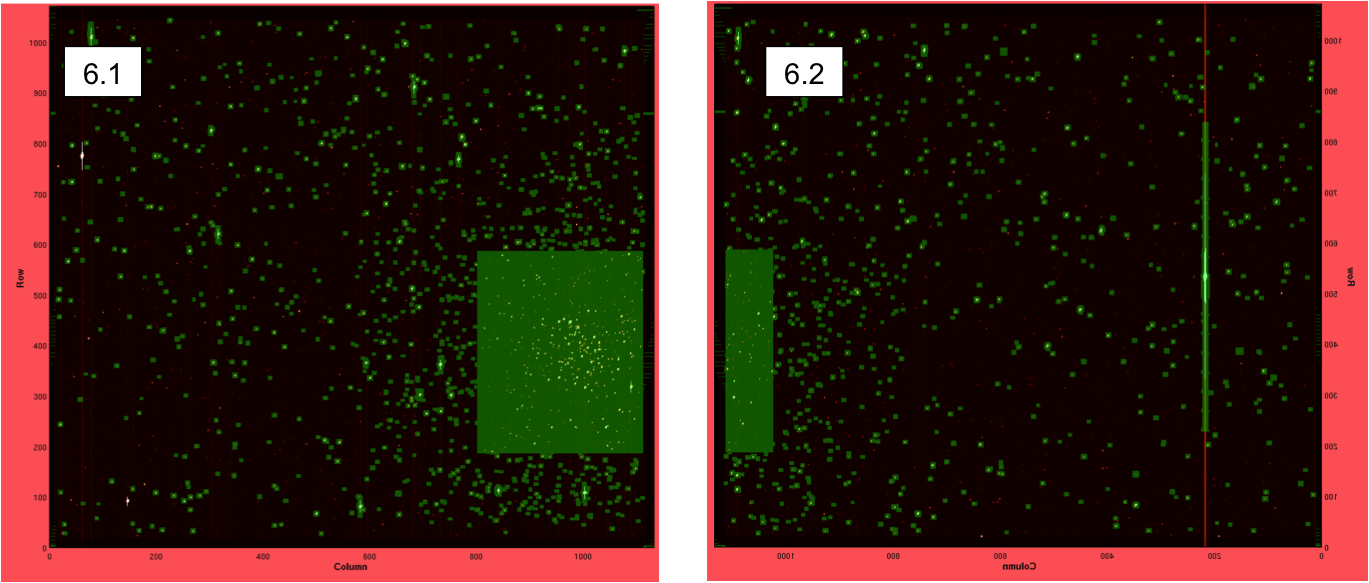
The open cluster M67 was observed by collecting a 400x400 region of sky near the core of the cluster in modules 6.1 and 6.2. See the image below. These data are grouped into 72 custom apertures, each with a 50x50 pixel mask or smaller. Their data are listed by custom aperture number at the MAST in the range 200008644--200008715.
Trans-Neptunian Object
The Trans-Neptunian Object TNO (126154) 2001 YH140 was observed in Campaign 5 by creating 565 1 x n pixel target definitions (where n ranges from 4 to 21) that cover the path of the TNO. The custom aperture numbers range from 200008716 to 200009280.
Noted Data Anomalies
Approximately 55.5 days after the start of C5, we note a small (~4000 electrons per cadence) increase in the median dark level that lasts approximately a day. The event is likely caused by a Coronal Mass Ejection, and its size is small compared to other normal variations seen in the dark level. This change in dark level is part of the normal calibration process that occurs in the CAL module.
One Argabrightening event was seen in the observed background level approximately 38 days into the campaign and affects a majority of the channels. This event is flagged on bit 13 in the QUALITY column of the light curve and target pixel files for those targets on the affected channels.
Data Quality and Processing Notes
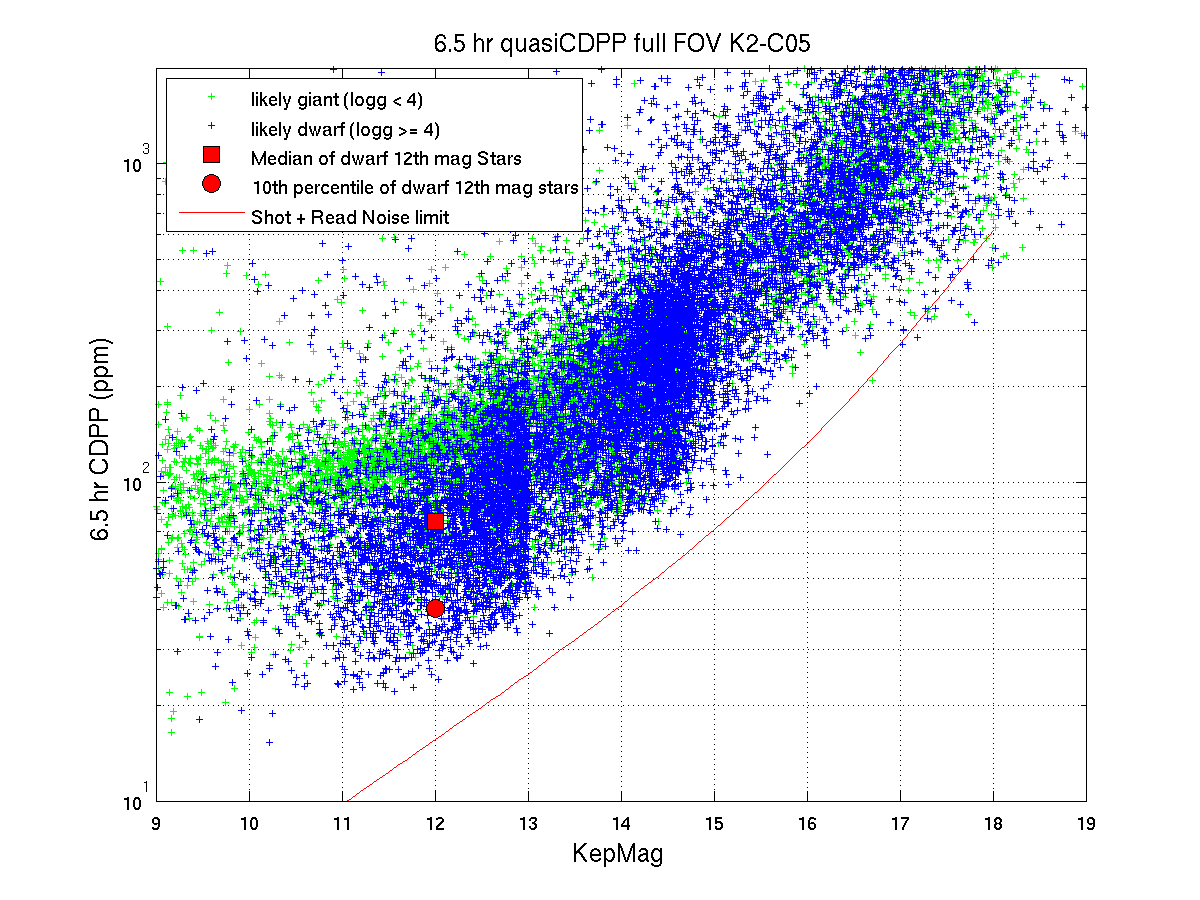
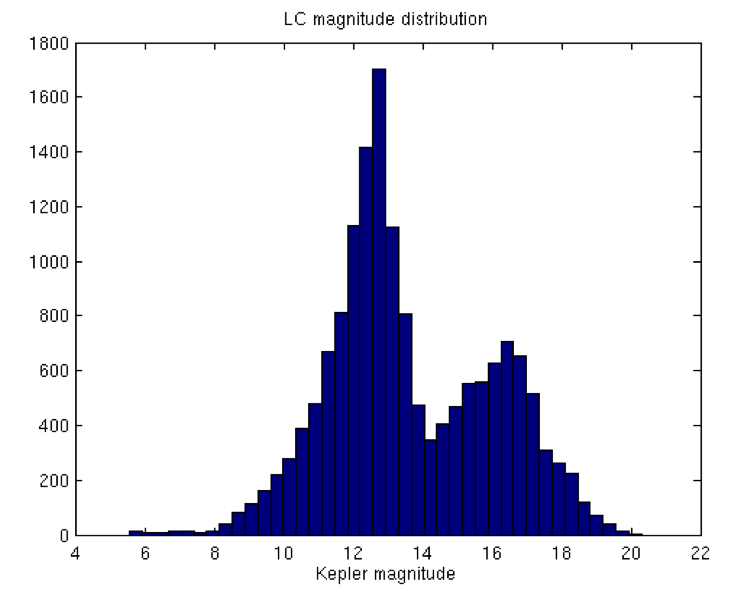
Light Curve Quality
The dominant systematic present in K2 simple aperture photometry light curves is a sawtooth shape that is due to the roll of the spacecraft approximately every 6 hours. The PDC module of the Kepler Pipeline uses Principle Component Analysis to remove this signal in addition to other systematics. Below, we examine observed noise levels in the PDC light curves for C5, Data Release 7.
Table giving 6.5-hr CDPP as a function of magnitude.
K2 Campaign 4 (Archived)
At a glance
- RA: 59.0759116 degrees
- Dec: 18.6605794 degrees
- Roll: -167.6992793 degrees
- 15,847 in long cadence (LC)
- 122 in short cadence (SC)
- Several custom targets (see below)
- Time: 2015-02-08 06:50:09.177 UTC
- Long Cadence Number: 103744
- Short Cadence Number: 3100780
- Time: 2015-04-20 04:32:47.045 UTC
- Long Cadence Number: 107213
- Short Cadence Number: 3204879

Features and Events
Pleiades and Hyades
One Director's Discretionary Target program (GO4901, PI:White) was approved in Campaign 4 which observes the nine 3–5 mag B-stars and red giants in the Pleiades and Hyades open clusters. The targets were observed using circular pixel masks (20 pixels in radius) that cover the wings of the PSF but not the entire saturation bleed.
The two stars in the Hyades are γ Tau and δ1 Tau. The seven stars in the Pleiades are: Alcyone (η Tau), Atlas (27 Tau), Electra (17 Tau), Maia (20 Tau), Merope (23 Tau), Taygeta (19 Tau) and Pleione (28 Tau). These stars are all listed in the EPIC; however, their data are listed by custom aperture number at the MAST in the range 200007765--200007773.
Trans-Neptunian Object
The Trans-Neptunian Object 2002 KY14 was observed in Campaign 4 by creating 1340 masks that cover the path of the TNO. The custom aperture numbers range from 200006425 to 200007764. These observations were taken as part of Guest Observer program GO4110 (PI:Schwamb).
Data Quality and Processing Notes
Background Residuals near Pleiades
Background removal for channels near the Pleiades has larger than normal residuals. These large residuals occur on mod.outs 10.3 and 15.1 through 15.4 due to the background on these channels being dominated by dust clouds near the Pleiades. The rich spatial structure of the Pleiades' dust clouds is poorly captured by the low order (≤ 4) polynomial model used to fit the background flux, with the best fit for these channels being given by a constant. This fit is done for every cadence, and the result is higher than normal background residuals, with residuals as large as 7 times the standard deviation of the background pixel values. (Normal residuals are typically less than the background standard deviation.)
We recommend caution when using light curves or the background model on these channels. Note that the FLUX column of the target pixel files contains calibrated pixels with the background subtracted. The amount of background that was subtracted per pixel can be found in the FLUX_BKG column and restored, if desired.
Local background estimates per star may produce higher-quality results. The change in the constant background level on these channels over time is in family with the median background change on other channels
Lightcurves Created with Non-Optimal Apertures
Due to an incompatibility between K2 roll motion and the determination of photometric optimal apertures, some light curves may be based on apertures that are too small and therefore have more noise than necessary. In particular, there are 887 stellar targets that are particularly suspect; they are listed here. The brighter targets in this set may have correct optimal apertures, but stars with Kp > 13 have been shown to have lower photometric precision than non-suspect stars of similar brightness.
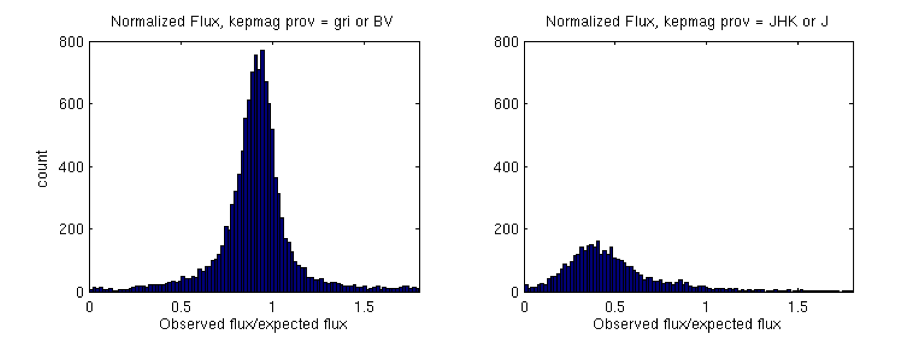
Stars Show Lower Than Expected Flux
The comparison of the meured flux to the flux based on their Kepler magnitudes in the EPIC catalog shows that ≈3,752 stars (23.8% of all stellar targets) are too bright by about a magnitude. The EPIC catalog field Kepflag gives the provenance of the Kepler magnitude estimate by listing the catalog magnitudes used to estimate the Kepler magnitude. Stars with Kepflag = “JHK” or “J” have Kepler magnitudes that are generally overestimated. These stars appear at all magnitudes, but predominantly have EPIC Kepler magnitudes dimmer than 14. The optimal apertures used to generate light curves for these “JHK” or “J” targets may be larger than optimal, reducing their photometric precision.
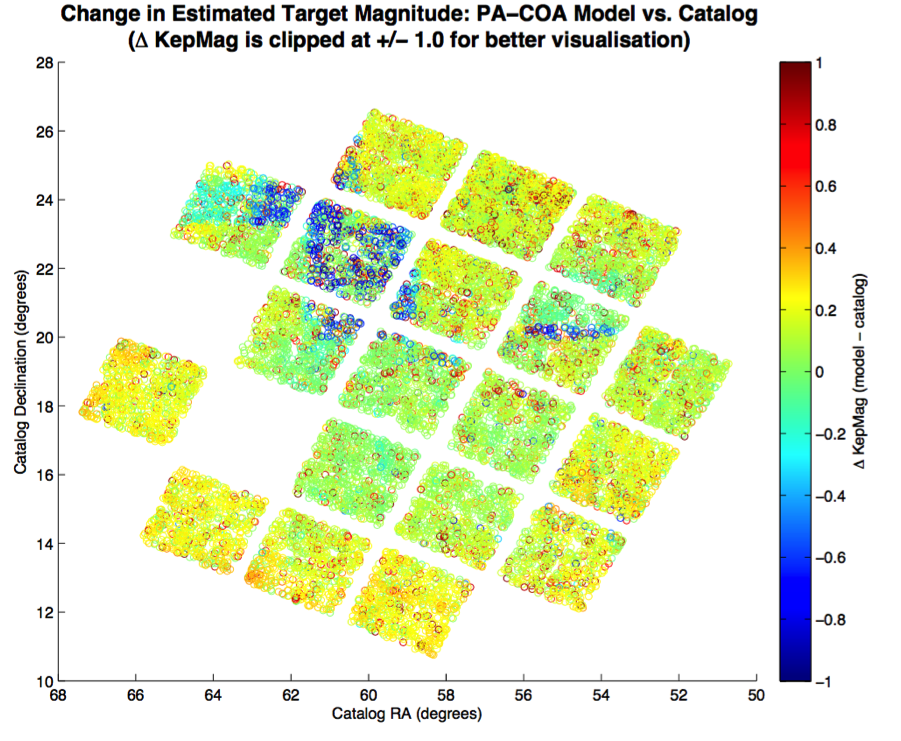
Several Stars Show Higher Than Expected Flux
There is a group of target stars whose measured flux is more than twice that expected from their EPIC Kepler magnitudes. The figure below shows that these stars fall into spatial groups that are aligned with RA and Dec, rather than focal plane coordinates, strongly indicating that the cause of this anomaly is catalog error. The source of this error is presently unknown and is not correlated with Kepflag values. The optimal apertures used to generate light curves for these targets may be smaller than optimal, reducing their photometric precision.
Stellar Targets with Negative Lightcurve Values
Seventy-six stellar targets show negative flux values in their SAP_FLUX light curves, which is somewhat more than normally seen. Most of these are very dim, near background level targets at the edge of the focal plane where K2 roll has the largest impact, so it is not surprising that the roll causes negative flux values after background removal. The bright targets with negative flux values either have isolated negative flux outliers or are on the Pleiades channels, where there are large background residuals due to the constant background model on these channels, see above.
Light Curve Quality
The dominant systematic present in K2 simple aperture photometry light curves is a sawtooth shape that is due to the roll of the spacecraft approximately every 6 hours. The PDC module of the Kepler Pipeline uses Principle Component Analysis to remove this signal in addition to other systematics. Below, we examine observed trends and noise levels in the PDC light curves for C4, Data Release 6.
Table giving 6.5-hr CDPP as a function of magnitude.
The photometric precision is generally better near the center of the focal plane where the variations in roll angle produce less pixel motion:
SC PDC Quality Flags
The PDC quality flags were populated for some of the SC targets even though there are no SC PDC light curves. These flags are: manual exclude (bit 9), SPSD detected (bit 11), and impulsive outlier removed (bit 12). Users may simply ignore these flags.
K2 Campaign 3 (Archived)
At a glance
- RA: 336.66534641439 degrees
- Dec: -11.096663792177 degrees
- Roll: -158.494818065985 degrees
- 16,375 in long cadence (LC)
- 55 in short cadence (SC)
- Several custom targets (see below)
- Time: 2014-11-15 14:06:05.515 UTC
- Long Cadence Number: 99599
- Short Cadence Number: 2976430
- Time: 2015-01-23 18:37:04.488 UTC
- Long Cadence Number: 102984
- Short Cadence Number: 3078009

Features and Events
Neptune
Neptune moved across the field of view during C3 and K2 observed it in both long and short cadence. Short cadence data were obtained approximately 20 days either side of the stationary point of Neptune. See this time lapse movie created by Jason Rowe that clearly shows Neptune and its moons, Triton and Nereid. The custom aperture numbers associated with Neptune are 200004468--200004923. These observations were taken as part of Guest Observer Programs GO3060 (PI:Rowe) and GO3057 (PI:Gaulme).
Trans-Neptunian Object
The Trans-Neptunian Object (225088) 2007 OR10 was observed with 2 masks and given custom aperture numbers 200004466 and 200004467. This target was observed as part of Guest Observer Program GO3053 (PI:Szabo).
Premature End
Campaign 3 had a nominal duration of 80 days, but an actual duration of only 69.2 days. The campaign ended earlier than expected because the on-board storage filled up faster than anticipated due to unusually poor data compression.
Data Quality and Processing Notes
Highlights of Pipeline Improvements
Campaign 3 (Data Release 5) data were the first K2 data processed with the SOC 9.3 pipeline. With this data release comes the higher-level data products. A detailed list of the pipeline developments that accompany this data release is listed on the pipeline release page. A few highlights are listed here:
- Quality flags now indicate which cadences were obtained during thruster firings.
- Background pixels were observerd and used to model the background level across the field of view. The calibrated pixels available in the target pixel files now have this background level removed.
- Simple Aperture Photometry (SAP_FLUX) and cotrended (PDCSAP_FLUX) light curves are available for long cadence data.
- The FFIs now contain a World Coordinate Solution.
Light Curve Quality
The dominant systematic present in K2 simple aperture photometry light curves is a sawtooth shape that is due to the roll of the spacecraft approximately every 6 hours. The PDC module of the Kepler Pipeline uses Principle Component Analysis to remove this signal in addition to other systematics. Below, we examine observed trends and noise levels in the PDC light curves for C3 (as measured using Data Release 5).
The short cadence light curves produced by the Kepler pipeline are inadequate for scientific research and are not being released at this time.
Reduced Noise from Change in Bandwidth
The change in bandwidth for pointing control (from 50 to 20 seconds) for C3 resulted in an increase in SNR for short cadence by a factor of roughly 4--9, with the larger improvement seen at the higher frequency end. Note, the bandwidth pointing control parameter was set to 10 seconds for the original Kepler Mission.
K2 Campaign 2 (Archived)
At a glance
- RA: 246.1264 degrees
- Dec: -22.4473 degrees
- Roll: 171.2284 degrees
- 13,399 in long cadence (LC)
- 54 in short cadence (SC)
- Several custom targets (see below)
- Time: 2014-08-23 18:27:16 UTC
- Long Cadence Number: 95497
- Short Cadence Number: 2853370
- Time: 2014-11-10 13:27:43 UTC
- Long Cadence Number: 99352
- Short Cadence Number: 2969049


Features and events
Solar Activity
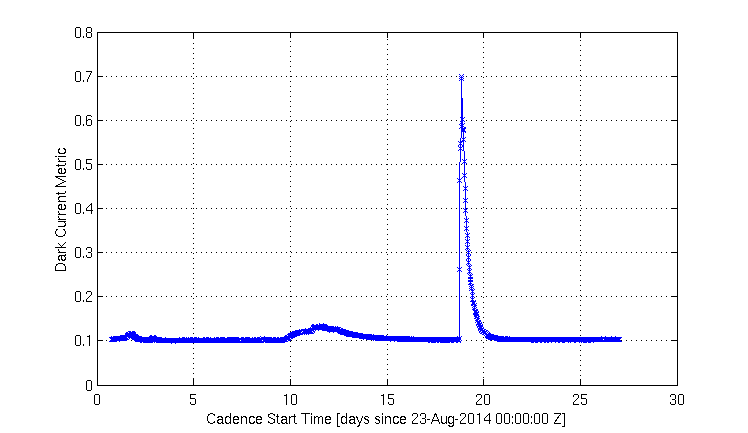
During C2 Kepler experienced two energetic particle events of note, likely caused by solar activity. Both events affected all channels as can be seen in the dark current metric plot for the first 26 days of C2 (see below). The first was a broad peak lasting approximately from cadence 95924 -- 96335 (01-Sep-2014 11:51:30 Z [MJD: 56901.4941] to 09-Sep-2014 21:24:55 Z [MJD: 56909.8923]). The second was a stronger more-peaked event lasting approximately from cadence 96357 -- 96551 (10-Sep-2014 17:01:54 Z [56910.7096] to 14-Sep-2014 07:20:35 Z [56914.30596]). At the peak of the 10-Sep-2014 event the average dark current increased by a factor of ~7 over the quiescent level. The GOES x-ray flux plot for this time shows an increased x-ray flux at Earth, though we don't have an independent measure of the exact timing and magnitude at the location of Kepler. The impact to the data will be in the form of increased background level, and increased photometric noise. The impact will be largest for faint targets.
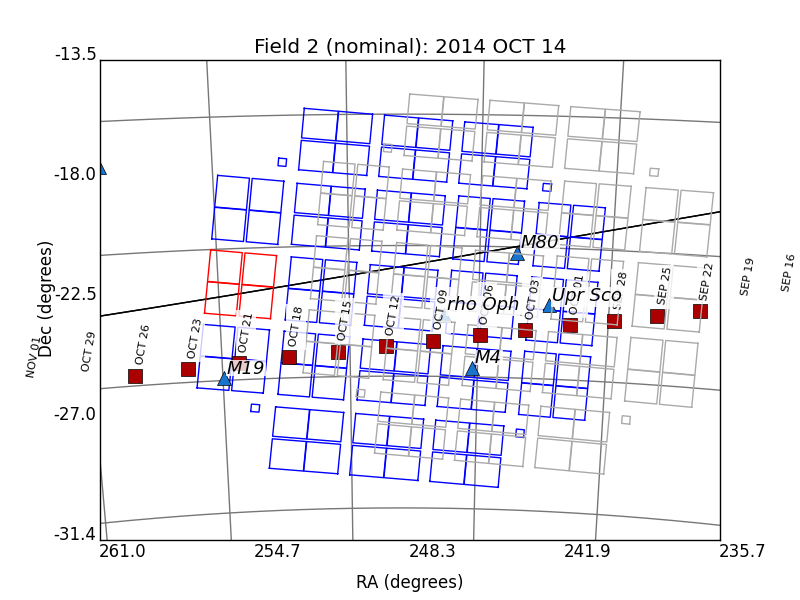
Mars
Mars passed across the field of view between October 1 and October 23. See the figure below for a prediction of where Mars is on the focal plane during Campaign 2. Mars is a bright object which will saturate the CCD. Both its image and its reflection will likely contaminate nearby stars.
LDE Flags
During the latter half of C2 we experienced a large number of parity errors coming from the photometer's local detector electronics (LDE). These LDE parity errors can occur when a very bright star saturates and spills charge into the CCD serial readout register, causing an overflow at the input to the analog-to-digital converter. While these errors were rare in Kepler, the very bright stars, or solar system planets, on the focal plane in K2 can cause frequent parity errors. For example, stars on channels 67 and 75 were the source of many of the parity errors during C2. These errors do not affect the quality of data from pixels on the active focal plane.
The LDE parity error triggers a flag (bit 15, decimal=16384) in the QUALITY column of the target pixel files. This flag is set for the majority of cadences in the second half of the campaign.
Attitude Tweak
The pointing of the spacecraft was adjusted by approximately 10" on 2014-Aug-25, during cadence 95546, in order to ensure that the observed targets were centered in their masks. This event is flagged in the QUALITY column of the target pixel files with bit 1 (decimal=1). The data collected before the tweak may fall close to the edge of the collected mask and some of the object's flux may have been lost. Use these cadences with caution. Note, in Data Release 4, because of an operator error, the tweak is marked on the previous cadence, 95545.
Two Globular Clusters
The clusters M4 and M80 were observed in C2 by collecting all the pixels in 50x50 pixel masks. For M4, 16 of these custom apertures were collected and for M80, 4 were collected. The data files for M4 range from 200004370 -- 200004385. The data files for M80 range from 200004386 -- 200004389. The target pixel files may be found by using the Object Type field on the MAST K2 data search page.
Two Solar System Objects
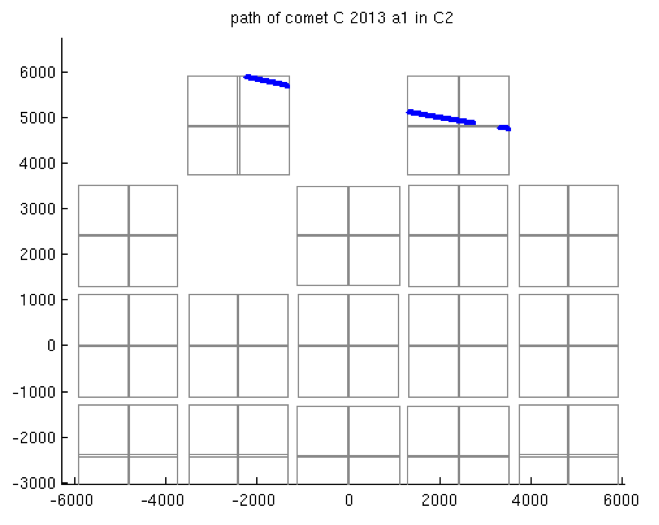
Comet C/2013 A1 (Siding Spring) was observed by obtaining 2583, 25x1 pixel, masks across module.outputs 2.3, 4.2, 4.3 and 4.4. These apertures were given custom aperture numbers ranging from 200001787 -- 200004369. This target was observed as part of the Guest Observer Programs GO2030 (PI:Kelley) and GO2046 (PI:Lisse).
The Trans-Neptunian Object (268361) 2007 JJ43 was observed with 661, 11x1 or 13x1 pixel, masks and given custom aperture numbers ranging from 200001126 -- 200001786. This target was observed as part of Guest Observer Program GO2066 (PI:Schwamb).
These data sets can be found at the MAST by entering the Investigation ID on the search form. The Investigation ID matches the GO Program number that requested the observations.
EPIC Catalog Assignment
For C2, a number of targets were proposed without EPIC ID numbers. If a target was observed, it was either 1) given an EPIC ID number from the regular catalog if that target matched a target in the catalog, or 2) assigned a new EPIC ID. We created EPIC ID numbers for 69 targets, ranging from 210282492 -- 210282560.
Release History
The following is the data release history for this campaign. Follow the link for information about some of the features of the software used to reduce and export these data. There will be a new entry each time the data is released by the mission.
K2 Campaign 1 (Archived)
At a glance
- RA: 173.939610 degrees
- Dec: 1.4172989 degrees
- Roll: 157.641206 degrees
- 21,732 in long cadence (LC)
- 56 in short cadence (SC)
- 1 custom target was selected in C1: TNO 2002 GV31, which was assigned EPIC ID 200001049
- Time: 2014-05-30 15:54:44 UTC
- Long Cadence Number: 91332
- Short Cadence Number: 2728420
- Time: 2014-08-20 20:19:37 UTC
- Long Cadence Number: 95353
- Short Cadence Number: 2849079

Features and Events
Operational Considerations
Campaign 1 (C1) is the first full length observing campaign for K2 where the targets were selected by peer review. The project was uncertain of the pointing precision and compression efficiency that could be achieved in early K2 operations and took steps to miminimize the risk of losing science data. In order to allow for the potential of coarse point operations, all target apertures included six halo rings. The oversized apertures and uncertain compression performance led the project to include a mid-campaign break lasting 2.9 days in order to downlink data.
Attitude Tweak
The attitude of the spacecraft was tweaked by 3.3 pixels at cadence 91433 to better position the targets in the centers of their apertures. All cadences in the first 2 days of C1 prior to this event have the first bit in the QUALITY column set (integer value = 1) to indicate that they were taken prior to the tweak.
When creating light curves, the pipeline uses PA-COA to determine the optimal photometric aperture that maximizes the signal-to-noise ratio for each target over the full campaign. This static optimal aperture is determined from a robust average of the achieved pointing, so relatively short segments of off-nominal pointing tend to be excluded from the aperture calculation. In the case of C1, the optimal apertures generally do not contain the target star in the pre-attitude tweak cadences. Accordingly, the SAP-Flux and PDC-Flux values found in the light curve files are gapped for the pre-tweak cadences (where the QUALITY flag=1). In addition, neither background flux (FLUX_BKG, FLUX_BKG_ERR) nor motion polynomial values (POS_CORR1, POS_CORR2) were computed for the pre-tweak cadences.
Because of the large C1 apertures, the TPFs do fully contain the target in the full set of pixels collected from the spacecraft. However, for the pre-tweak cadences incorrect background flux values were subtracted from the TPF pixel fluxes given in the FLUX column of the TPF. Users wishing to recover photometry from these cadences should add the per-cadence pixel background values (TPF column FLUX_BKG) back into the pixel flux values and then compute their own background levels. The position offset columns (POS_CORR1, POS_CORR2) should likewise be ignored for these cadences.
Finally, in the pre-tweak cadences a small number of targets may have incorrect smear calibrations due to bright saturating stars spilling charge into the detector smear regions. Such affects are flagged and excluded from smear calibration for the post-tweak cadences, but the pre-tweak positions of the bright stars were not used to flag bad smear corrections. Only about 0.2% of the focal plane columns were affected in this way, so the number of potentially affected targets is small.
Trans-Neptunian Object
A long-cadence custom aperture was constructed in order to collect data on trans-Neptunian Object 2002 GV31. Note, this target is very faint (V=22) and falls in its 23x22 pixel custom aperture for only about 10 days. This custom aperture can be found by searching the MAST for EPIC ID 200001049.
EPIC Catalog Assignment
For this Campaign, a number of targets were proposed without EPIC IDs. If a target was observed, it was either 1) given an EPIC ID from the regular catalog if that target matched a target in the catalog, or 2) assigned a new EPIC ID. We created EPIC IDs for 28 targets, ranging from 210282464 to 210282491. The remaining C1 targets have EPIC IDs ranging from 20100000001 to 202059065.
Data Quality and Processing Notes
Light Curve Quality
C1 long cadence light curves have been delivered with Data Release 14. The dominant noise contributors in the C1 data are the saw-tooth roll signal inherent in K2 data and an increased (over Kepler and later K2 campaigns) cross-boresight pointing motion due to the lower bandwidth for the attitude determination and control system (ADCS) used in K2 campaigns C0, C1, and C2. The low ADCS bandwidth was particularly problematic for short cadence data, as it meant that the spacecraft pointing errors are on the same time scale as the SC exposure, so that the pointing induced noise is correlated from cadence to cadence. See notes under C0 for details.
Analysis of the light curve quality reveals that long cadence CDPP values for dwarf stars are
in family with the values from subsequent campaigns.
The magnitude dependence of CDPP and its distribution over the focal plane are shown below.
Other CDPP benchmarks can be found in the
table giving 6.5-hr CDPP as a function of magnitude.
K2 Campaign 0 (Archived)
Campaign 0 (C0) was implemented as a full-length engineering test to prove that K2 was a viable mission. It observed sources "at risk" from a community-provided target list.
At a glance
- RA: 98.2985439 degrees
- Dec: 21.5904167 degrees
- Roll: 177.4754730 degrees
- ktwo2014070234206-c00_ffi-cal.fits
- ktwo2014074233223-c00_ffi-cal.fits
- ktwo2014110010101-c00_ffi-cal.fits
- Time: 2014-03-12 00:18:30 UTC
- Long Cadence Number: 87434
- Short Cadence Number: 2611480
- Time: 2014-05-27 16:48:13 UTC
- Long Cadence Number: 91186
- Short Cadence Number: 2724069

Features and Events
Not In Fine Point Data
The second half of the C0 data is more indicative of the quality of data users should expect from K2. The Kepler spacecraft was not in fine point for the first part of C0, causing large photometric scatter. The data quality is much improved in the second half of the campaign, beginning on cadence 89347 after the safe mode, when compared to the first half of the campaign. See the QUALITY flag (bit 16) to determine when the spacecraft was in fine point.
Safe Mode
The Kepler Spacecraft was in safe mode between cadences 88198 and 89346. Data is flagged in the QUALITY column with bit 2. The project used this time to fix large attitude errors that were occuring during resaturation events.
Module 7 Failure
Prior to the start of C0, on January 21, 2014, the photometer was autonomously powered off by an under voltage fault in the Local Detector Electronics Power Supply. Since that time, module 7 (i.e., channels 17 to 20) has yielded no star data or charge injection signal. The subsequent behavior of this module is very similar to that of module 3 after it failed on January 19, 2010. K2 continues to operate and collect simultaneous data from sources falling upon the remaining 19 detector modules over 105 square degrees. There is no indication of any accelerated degradation on these other modules.
Large Pixel Masks
When planning C0 observations, the pointing performance of K2 was not accurately known. The worst case scenario was that a star at the edge of the focal plane could move as much as 40" from its nominal position. Therefore each star was assigned a large pixel mask by first computing a Kepler-style optimal aperture and then adding 10 rings of pixels to account for a potential 40" pointing offset. During the second half of C0, the pointing performance was excellent and the pointing drifts were no more than 6" for any target star. Care will be needed when performing photometry on C0 data. Simply including all collected pixels for a given target will not create a high signal-to-noise light curve. For tools to help choose your photometric aperture, see for example, PyKE contributed software.
Jupiter's Reflection
Because K2 points along the ecliptic, its field of view will occasionally contain bright solar system objects. Jupiter was in the K2 field of view during C0 from 2014-03-14 through 2014-05-12, but fell on dead module 3. It creates a bright antipodal ghost on module 23, channel 79, and impacts all the targets observed in this region. See the FFI ktwo2014074233223-c00, extension 79, for an image of the reflection.
While Jupiter was on the focal plane, the background level was increased over its nominal value for nearly half the channels, with the largest impact seen in channels 53 -- 84. In addition, as Jupiter moved on and off the focal plane, a specular reflection lasting approximately 6 hours was seen in these channels. The relative background levels as measured in the smear signal from channel 83 are shown below as Jupiter enters the focal plane (near cadence no. 87525) and leaves the focal plane (cadence no. 90375). The specular bump resulted in an increase in background level of 25-30% for the affected channels, while the quasi-static background increase for the time Jupiter was on the focal plane was 3-5%.

Observations of M35 and NGC 2158
The open clusters M35 (NGC 2168) and NGC 2158 were observed during this campaign by placing 154 separate 50x50 pixel masks over the densest portion of these two adjacent clusters. Each mask was given a custom aperture number to act as the unique identifier found in the file name. The target pixel files for these clusters have custom aperture numbers ranging from 200,000,811 to 200,000,964.
Data Quality and Processing Notes
Photometric Jitter Caused by Lower Bandwidth
During the development of the K2 Mission, the number of guide stars per fine-guidance sensor (FGS) was changed from ten (for Kepler) to one (for K2). This change was demanded by the need for increased aperture sizes given the uncertainties in the star-tracker to boresight alignment and the need to acquire an entirely new field-of-view every 80 to 90 days. To compensate for the increased sensor noise and assure that fine-point lock could be achieved, the attitude control bandwidth was decreased from 0.1 Hz (for Kepler) to 0.02 Hz (for K2). This change in bandwidth means that the cross-boresight attitude (i.e., RA and Dec) has a time constant of 50 seconds, comparable to the short-cadence duration. Engineering studies have shown that the photometric precision of the long-cadence data is also compromised by the larger pointing jitter associated with the lower bandwidth. The project has approved a change in bandwidth to 0.05 Hz (20 seconds) starting with Campaign 3.
Channel 10 Black Correction
The black correction on Channel 10, mod.out 4.2, has problems because a bright star bleeds into the black region. For data release 1, the affected regions of the black are excluded from the fit of the black, so the fit is poorly constrained and we see chatter in the residuals. This mostly affects stars in the last 200 rows of the channel.
Image Artifacts in K2
The thermal environment is changing more rapidly in K2 than it did for the Kepler Mission. As a result the number of channels with significant rolling band (changes in the black level that are both time and spatial dependent) is larger for K2. The channels observed to be most impacted by rolling band in C0 are 1, 2, 10, 11, 14, 25-28, 36, 44, 58, 62, 74 and 79. Other known image artifacts, such as Moiré patterns and undershoot from bright stars, are also likely to be enhanced in K2 data as compared to Kepler. See the Kepler Instrument Handbook.
Thruster Firing Flags
Since the thruster firing flags are not populated in FITS quality flags for the C0 Type-1 TPFs, they are delivered as separate long-cadence (thruster_firing_flags_c0_lc.csv) and short-cadence (thruster_firing_flags_c0_sc.csv) thruster firing tables for the C0 campaign.